- XRP has fallen nearly 50% from its peak and is struggling below $2.
- A potential double top pattern points toward downside risk near $1.
- Holding support around $1.78 could prevent a deeper breakdown.
XRP has retraced close to 50% from its multi-year high near $3.66 and is now trading below the $2 level, a shift that’s raising fresh concerns among technical analysts. The drop has pushed XRP into a fragile chart position, where failure to reclaim lost support could open the door to a deeper correction. Veteran trader Peter Brandt has warned that the current setup carries clear bearish implications if key levels fail to hold.
A Potential Double Top Puts $1 in Focus
According to Brandt, XRP’s weekly chart is showing signs of a possible double top formation, a classic reversal pattern that often appears near major market peaks. The structure remains active as long as XRP trades below the neckline around $2. A weekly close beneath that level would confirm the pattern and increase the probability of a move lower over the coming weeks or months. While Brandt acknowledged the setup could fail, he emphasized that, for now, the risk tilts to the downside.
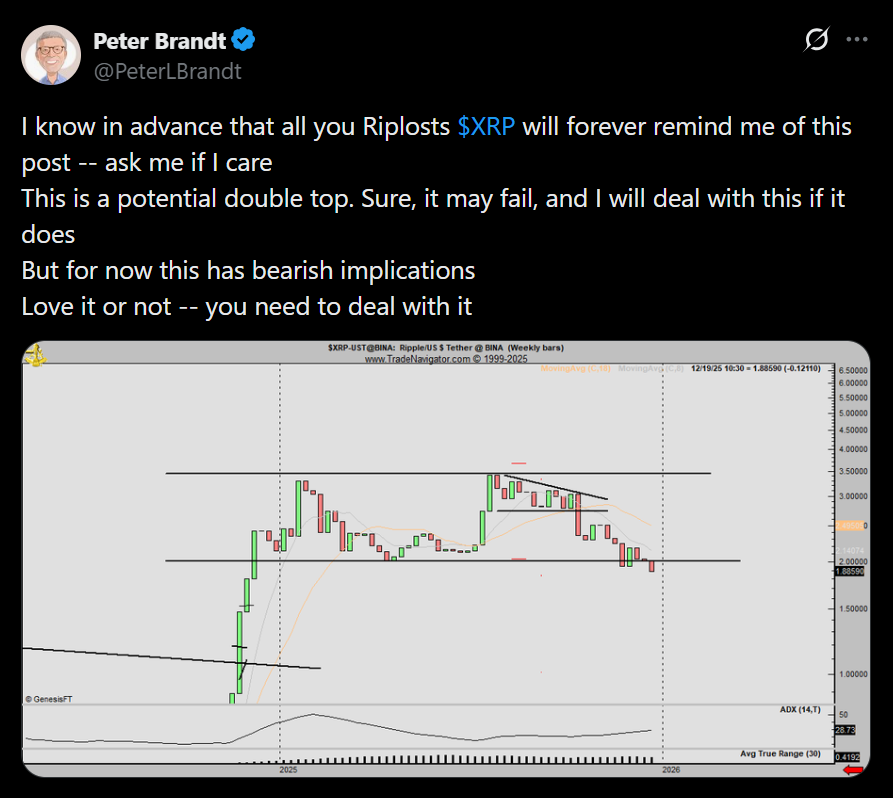
If the bearish structure plays out, XRP could initially slide toward $1.65, where the 100-week simple moving average sits. Below that, the 200-week SMA near $1.07 represents a critical long-term support zone that bulls will likely defend aggressively.
Elliott Wave Models Point to Deeper Pullback
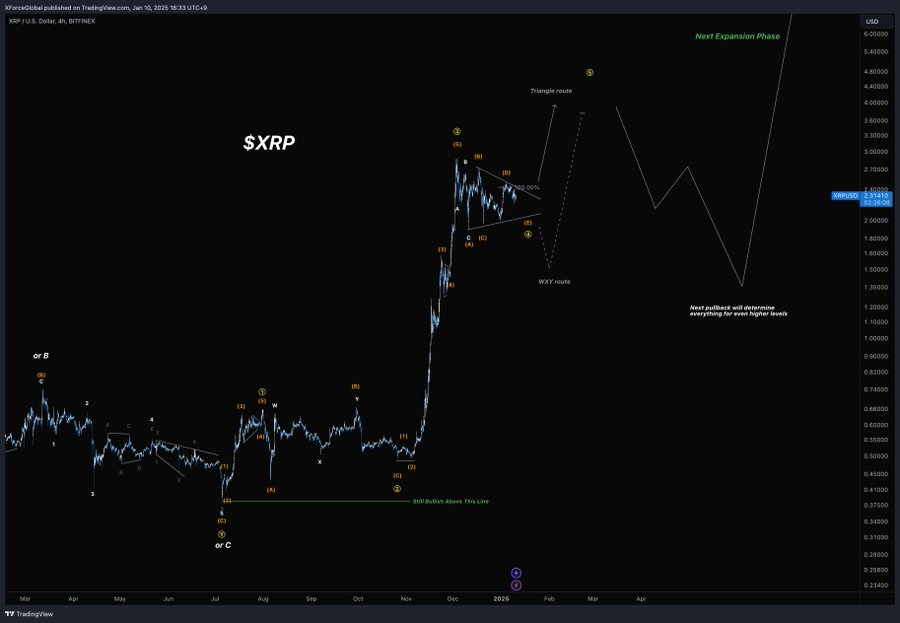
Additional downside scenarios are being flagged by Elliott Wave analysts. XForceGlobal attributed the recent weakness to a wave-three corrective move within a broader five-wave structure following a triangle breakout. Under that framework, XRP could retreat into the $1.20–$1.35 range before setting the stage for any meaningful expansion phase. Similar conclusions were drawn after XRP rolled over from its 20-day moving average near $2, increasing the probability of a retest of October lows.
Echoes of XRP’s 2018 Breakdown
Some analysts are drawing uncomfortable parallels between XRP’s current structure and its 2018 bear market setup. Back then, the loss of a critical support level led to a sharp 70% decline. With $2 now acting as resistance rather than support, a similar scenario cannot be ruled out. In a more extreme case, XRP could slide toward the $0.60 region before eventually stabilizing closer to $1, mirroring the post-breakdown behavior seen seven years ago.
A Key Support Level Still Stands
Despite the growing bearish narrative, XRP bulls aren’t completely out of options yet. Onchain data from Glassnode’s UTXO realized price distribution highlights a significant demand zone around $1.78, where roughly 1.85 billion XRP were previously accumulated. Analysts note that holding this area could invalidate the most aggressive downside targets.
Mikybull Crypto described the $1.70–$1.80 range as a must-hold zone on the higher time frames. If that support fails, downside pressure could intensify rapidly. For now, XRP sits at a crossroads, with its next major move likely hinging on whether buyers can defend this final line.