
- TRON outperformed Bitcoin during the recent selloff, helped by a surge in volume and positive Revolut partnership news
- Despite the bounce, TRX remains structurally bearish on higher timeframes
- A move toward $0.283–$0.29 may offer selling opportunities unless price can hold above resistance
Market volatility on December 14 dragged Bitcoin down about 3.2%, yet TRON moved the other way. TRX climbed roughly 4.5% in just over a day, flashing relative strength while most of the market struggled. Trading activity backed that move too, with daily volume jumping 45%, according to CoinMarketCap.
Part of the momentum likely came from news earlier in the week. On December 11, TRON DAO announced a partnership with Revolut, a global fintech platform serving more than 65 million users. Revolut’s decision to integrate TRON as blockchain infrastructure sent a signal of confidence in the network’s capacity, and traders were quick to notice. The big question now is whether that optimism can actually stick.
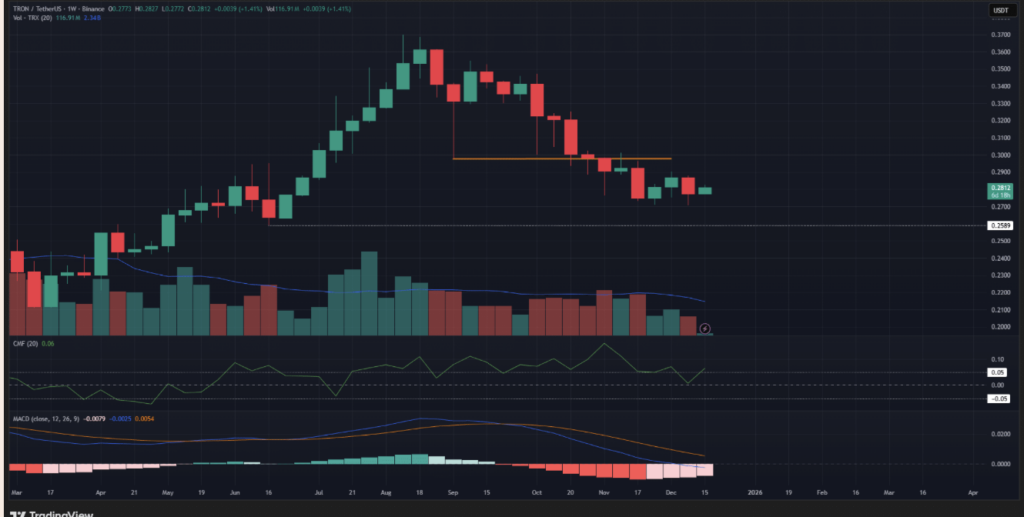
Weekly Structure Still Leans Bearish
Zooming out, the weekly chart doesn’t fully agree with the recent pop. TRX broke below its prior higher low around $0.30 back in September, shifting the broader structure to the downside. If price revisits lower levels, the $0.259 area stands out as the next meaningful weekly support.
Momentum has also turned against bulls on this timeframe. The MACD printed a bearish crossover in September and has been drifting lower since, with the MACD line sitting below zero. That setup often signals that a pullback is turning into something more persistent. Interestingly, the CMF remains above +0.05, hinting at continued capital inflows. Still, structure tends to lead, and structurally, the weekly chart remains bearish.
Lower Timeframes Show a Similar Pattern
The 4-hour chart doesn’t offer much relief either. TRX is still trading below the $0.282 level, which keeps the short-term structure tilted bearish. Until price can reclaim that zone, upside attempts remain suspect.
That said, short-term momentum has clearly improved. CMF shows stronger buying pressure over the past 24 hours, and the MACD reflects a burst of upward momentum. This clash between momentum and structure is where things get tricky, and where traps often form.
A Bounce That Could Fade Quickly
Given TRX’s recent strength against Bitcoin, a push higher wouldn’t be surprising. Price could bounce toward the Fibonacci retracement zone between $0.283 and $0.286, potentially breaking the 4-hour bearish structure. On the surface, that might look like a breakout.
The risk is that it doesn’t last. With the weekly and daily structures still bearish, such a move could end up being short-lived and quickly retraced. That’s why some traders are viewing this rally as a potential bull trap rather than the start of a new trend.
Levels to Watch if Momentum Fades
If TRX does push into the $0.283–$0.286 range, it may present a selling opportunity rather than a chase. The broader supply zone extends up toward $0.29, and unless price can hold above that area, downside targets come back into play.
Failure to break higher could send TRX back toward $0.27, with $0.259 as a deeper support level for swing traders watching to take profits. A clean move above $0.29 would invalidate the bearish outlook, but until that happens, caution still makes sense.