- Dogecoin is testing a Wyckoff Spring-style support zone, with repeated lows, absorption, and no clean breakdown, hinting at a potential reversal setup.
- A developing MACD bullish cross on the 3-day chart, combined with support at $0.15–$0.18 and a descending channel base, points to early signs of momentum recovery.
- Long-term charts show DOGE in its longest accumulation phase ever, with rising cycle floors suggesting structural demand and the possibility of another major breakout if support holds.
Dogecoin’s price has been hovering around a really important level lately, almost like it’s catching its breath after weeks of sliding around inside a tight range. Several long-term indicators are lining up for the first time in a while, and analysts are beginning to watch the chart a bit more closely. The whole structure looks like it’s sitting in the middle of a bigger accumulation phase, the kind where nothing happens for ages… until suddenly everything does.
Wyckoff Spring Signal Appears as DOGE Tests Support
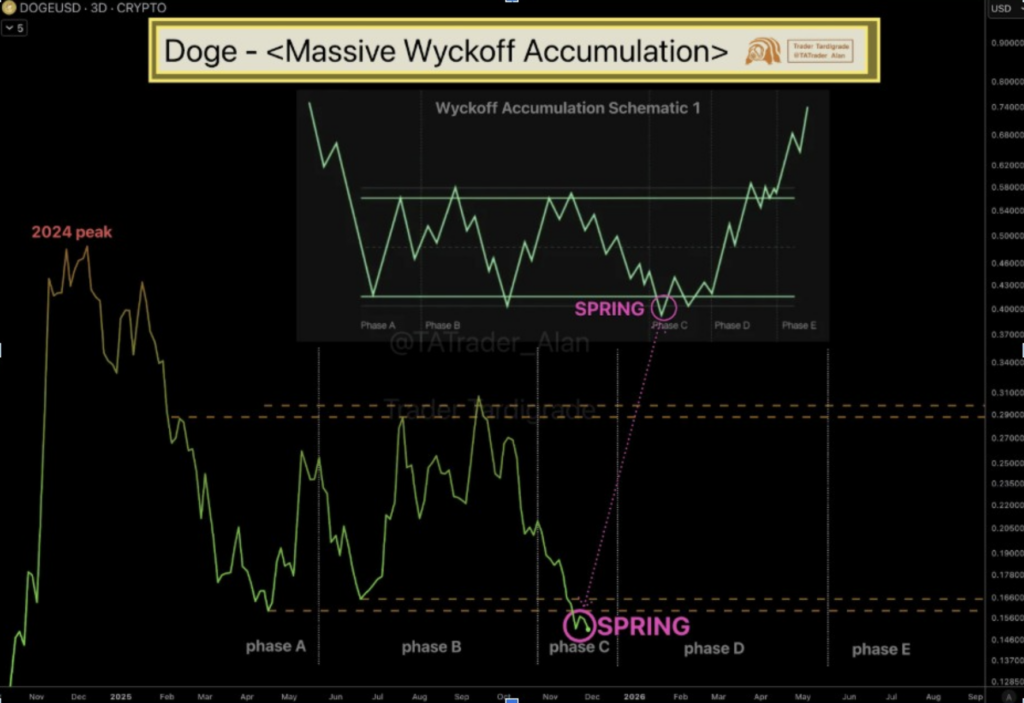
Right now, DOGE is sitting inside what Trader Tardigrade calls a Wyckoff Spring Setup—a classic Phase C dip where price slips just below support, scares off weak hands, then snaps back sharply. These little “false breakdowns” tend to act like liquidity sweeps before a real reversal begins. According to his chart, price behavior fits almost perfectly inside the projected Wyckoff Phases D and E, if support continues to hold through the next few sessions.
What makes this interesting is how familiar the structure looks when compared to previous major accumulation cycles. DOGE has been printing repeated lows in the same region, showing absorption rather than breakdown—almost like something slow and steady is rebuilding underneath. Tardigrade’s Spring signal adds another layer here, hinting at a shift in dynamics that’s been brewing quietly.
MACD Cross Strengthens the Bullish Case
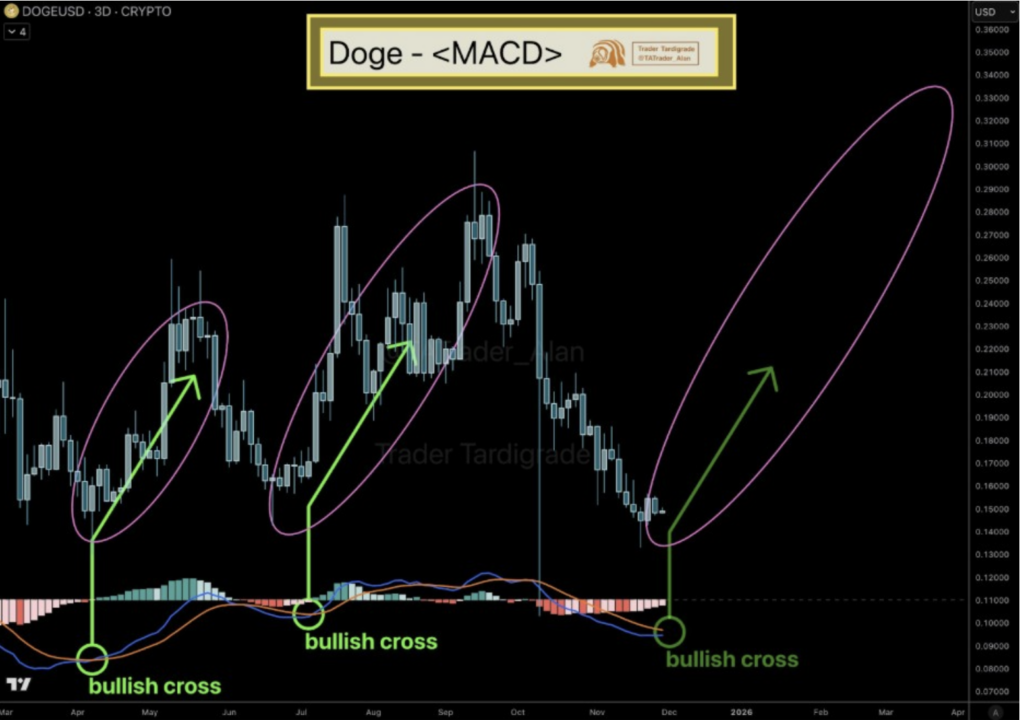
Another early indicator flashing green is the MACD on the 3-day chart. A bullish cross is forming—something that has only happened a handful of times in the past, each one followed by a multi-week breakout that cleared local resistance levels. It’s still developing, but the structure looks eerily similar to those earlier setups.
Momentum has been weak for weeks, but the histogram now shows negative pressure thinning out. Candles near support have started forming smaller bodies too, suggesting sellers are losing steam. When you combine all these little signals together, they start looking like early-stage recovery patterns—tiny clues scattered across the chart. If the MACD cross completes, traders will likely target the next mid-range resistance as the first big test.
BitGuru also pointed out a support zone between $0.15 and $0.18, a level that has caught multiple reactions already. He warned that a breakdown below this could delay any rebound, but emphasized that staying above this band is crucial for the next bullish swing.
DOGE Still Stuck in a Descending Channel
Analyst Don highlighted a descending channel that’s been guiding DOGE since earlier in the year. Lower highs, lower lows… the whole structure fits neatly into a downward-sliding pattern. Price is currently hanging near the lower end of that channel—the same region where most reactions have formed recently.
There’s also a long-term diagonal resistance dating back to last year. According to Don, breaking above this line is essential if DOGE wants any real chance at sustained upside. His next major resistance level sits around $0.23. If DOGE bounces from the lower channel and tests the upper band, that zone becomes the first major checkpoint on the road upward.
Interestingly, these long descending channels often form right before expansion phases during late accumulation. It’s the kind of price action where volatility gets compressed so tightly that eventually something has to give.
A Massive Multi-Year Accumulation Trend Is Still Intact
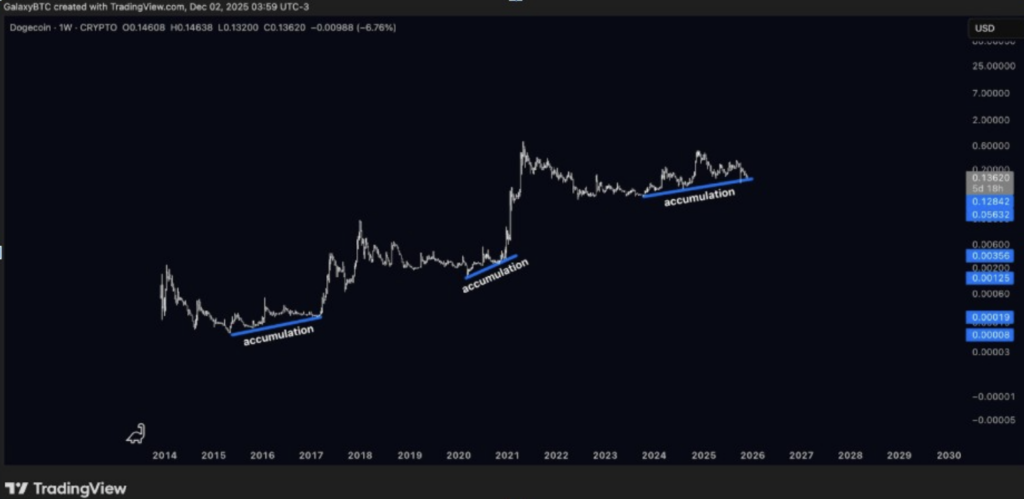
On the higher-timeframe charts, GalaxyBTC pointed out something even bigger: Dogecoin is in the longest accumulation phase in its entire history. His charts highlight three major accumulation periods—2015-2017, 2019-2020, and the current one, which has lasted even longer.
Each previous phase ended with a huge breakout, almost explosive in scale. The floors have been rising over the years too, which suggests structural demand is still there despite the choppy price action. GalaxyBTC believes this phase could be setting up another one of those large cycle expansions, potentially tied to a broader altcoin season.
Dogecoin now edges closer to another major cycle point, and if support continues to hold, the alignment between long-term structure and short-term signals becomes even more meaningful. Galaxy’s long view ties neatly into what the other analysts are seeing on the lower timeframes—a market that looks quiet on the surface but may be quietly preparing for something larger.