
- LINK rejected sharply from $13.5 and now trades near $12 support.
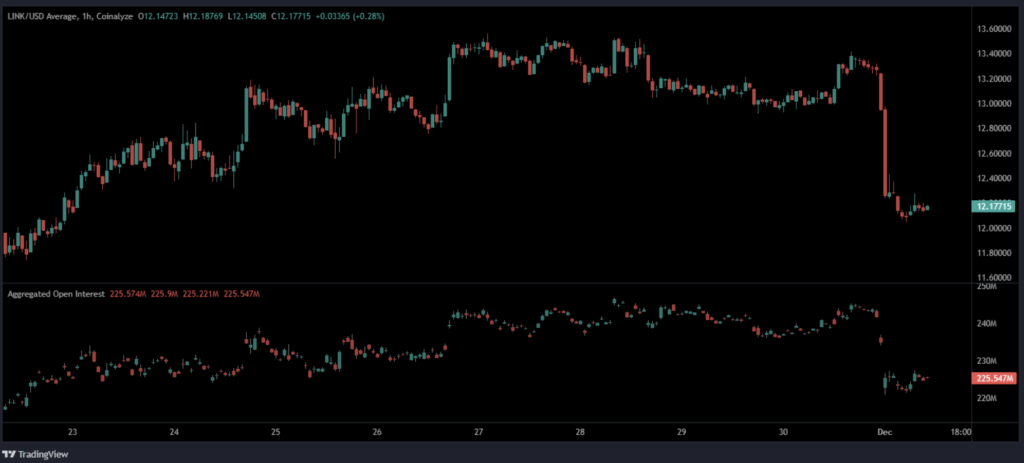
- Open interest dropped as leverage got flushed, confirming bearish pressure.
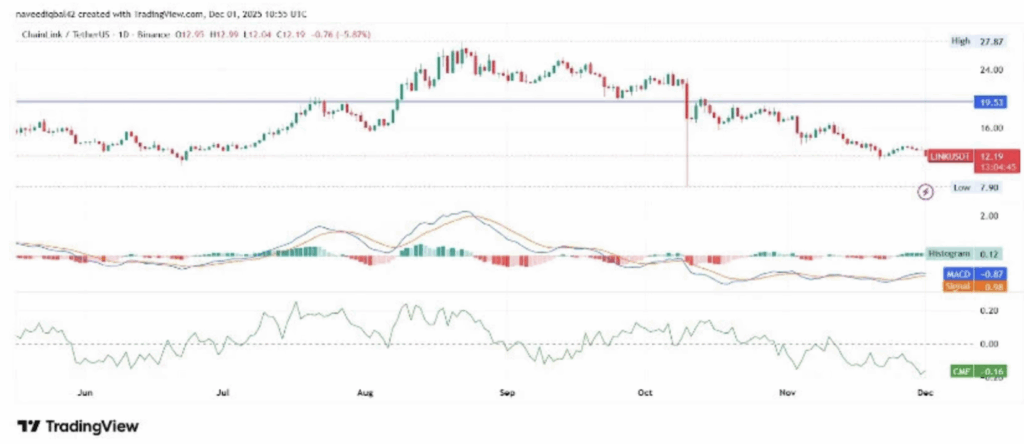
- Indicators remain weak until LINK can reclaim the $15–$16 region.
Chainlink is looking shaky again after a sharp intraday breakdown sent the price tumbling out of the mid-$13 range. The move wasn’t subtle either — the rejection hit fast, wiped out the earlier sideways structure, and left LINK drifting back toward the low-$12 zone with momentum clearly shifting toward sellers. Open interest is thinning out as leveraged traders get flushed, and broader indicators across the market aren’t offering much comfort either.
Open Interest Drops as Leverage Gets Wiped Out
On the 1-hour chart, LINK is hovering around $12.18, still recovering from yesterday’s hard rejection at the $13.40–$13.50 region. That zone has now solidified into a pretty firm ceiling. The breakdown candle that triggered the move erased the mild bullish structure entirely, leaving price trapped in a tight band just above $12 — more hesitation than accumulation.
Open interest currently sits near 225.5M, down from the 240M+ levels seen during consolidation. The drop lines up almost perfectly with the liquidation spike, showing long positions got forced out as price cracked structure. It’s the kind of flush that resets momentum, usually in favor of the downside.
Market Data Shows Cooling Conditions, Not a Pivot
BraveNewCoin’s metrics show LINK trading around $12.38, down 5.01% for the day. Market cap sits at $8.6B, with $472M in 24-hour volume — active rotation, sure, but nothing signaling a major trend change yet. The token still sits inside the same corrective channel that’s been guiding price for weeks.
With a circulating supply of 696.8M LINK, the asset holds Rank 21, but weekly behavior keeps repeating the same story: LINK can’t hold above the mid-13 region. That level has shifted from a breakout area to a structural lid, rejecting every attempt to reclaim it.
Intraday charts show repeated wicks and accelerations downward whenever LINK gets too close to the upper boundary of the range. This all matches the current Chainlink price prediction narrative — strength is capped until buyers can prove they can defend meaningful resistance.
Indicators Stay Bearish as LINK Struggles Below Key Levels
On the daily timeframe, LINK trades near $12.19, extending its 5.9% decline. More importantly, it remains miles below the $19.53 horizontal resistance that has blocked every medium-term breakout attempt since summer. Lower highs keep forming, confirming an ongoing downtrend. Recent candles show small bounces that fade almost instantly — a sign bulls simply don’t have the energy yet.
Momentum indicators aren’t offering a bullish twist either:
- MACD: −0.87 (still below the −0.98 signal line)
- Histogram: barely positive at 0.12
- CMF: negative at −0.16, showing continued outflows
These readings hint at easing selling pressure but nowhere near a trend reversal. Until MACD curls up toward the zero line and capital flow shifts positive, LINK stays vulnerable.
What Chainlink Needs Before Sentiment Turns Around
For LINK to escape this consolidation and revive any real bullish sentiment, it has to:
- Reclaim $15–$16
- Break and retest $19.53 with strength
Without those confirmations, the chart leaves space for more sideways drift or a deeper slide into lower support zones.
Right now, LINK looks like it’s stuck between fading momentum and still-dominant sellers — and here is where the next move could decide whether this correction extends or stabilizes.