
- HYPE forms a new low despite strong fundamentals and revenue growth.
- Major support lies at $28–$30, with deeper support at $21–$23.
- A real trend reversal requires a break and reclaim of $45 — until then, the downtrend stays in control.
The crypto market took another hit this week, and Hyperliquid wasn’t spared. HYPE formed a fresh low — again — leaving traders wondering how much deeper this slide can go. Are investors scared? Still confident? What does liquidity say about the real state of this market? Too many questions, honestly, but the answers usually hide in the charts long before they show up in sentiment.
What’s strange is that fundamentals haven’t collapsed at all. Usage is strong, daily revenue keeps flowing, and Hyperliquid Strategies aims to raise a massive $1B for HYPE purchases. On paper, that’s the kind of fuel bulls love. So… why is the price still rolling downhill?
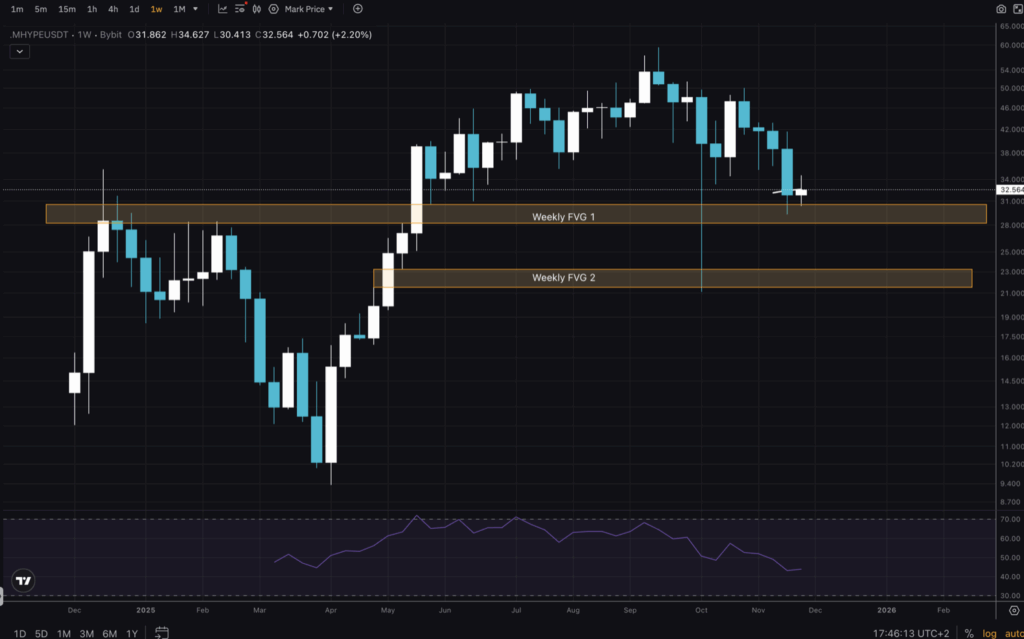
Weekly chart: Support levels get tested as RSI drifts lower
Looking at the 1W chart, we can spot two major Weekly FVGs. The upper one — between $28 and $30 — is being tested and filled right now, making it the first real support zone. The second sits around $21–$23 and could become a bigger deal if things keep slipping. There aren’t many moving averages to lean on at this timeframe, but RSI continues drifting downward and now sits around the middle of its range, not oversold but definitely leaning soft.
Daily chart: Downtrend clearly defined, MAs lost, momentum weak
Zooming into the 1D chart, the downtrend becomes painfully clear. Price broke below the previous low, creating a market structure break. A lower high formed soon after as HYPE got rejected from a bearish orderblock — not exactly a great sign. The continued drop pushed the price below all major moving averages (yes… all of them), and that alone confirms the bearish structure.
Now traders are asking whether we get a classic bounce back into the underside of those MAs to form another lower high. RSI here is stuck at the bottom of its range, showing momentum is exhausted but not yet flipping.
4H chart: A potential trade setup forms despite the chaos
Moving into the low timeframes — the 4H chart — things get a bit more interesting. A clear range is forming, with visible levels that traders can use. The previous low (marked in yellow) might act as resistance, but price could break above it briefly just to test the bearish orderblock overhead.
For aggressive traders, a long entry at current levels with a stop below the lower low and a take-profit near the purple zone offers roughly a 1:3 risk-to-reward. RSI is low here as well, giving room for a possible squeeze upward.
What bulls need for a real trend reversal
To flip this chart bullish again, buyers have a lot of work ahead. They would need to break above $45 and reclaim it as support — not a small task given recent price behavior. Until that happens, this remains a downhill ride with occasional bounces. Stay cautious, stay patient, and please… keep stops in place. Here is where discipline matters more than hope.