
- DOGE bounced after weeks of decline, helped by the launch of Grayscale’s new Dogecoin ETF and short-term bullish divergences on RSI and MACD.
- A breakout from the wedge could send the price toward $0.20, confirming the end of its five-wave downtrend.
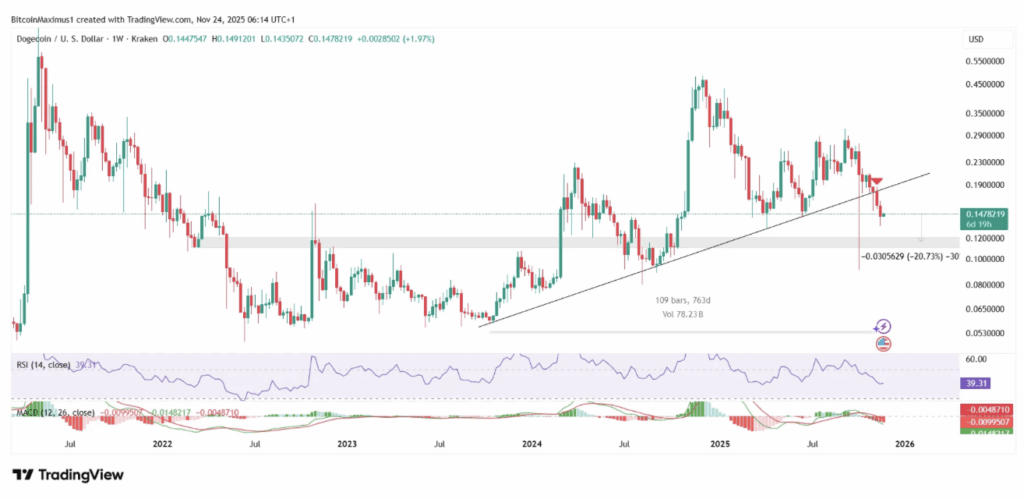
- Despite the short-term rally, the weekly chart remains bearish, hinting that DOGE could still drop toward $0.115 if the larger trend continues.
Dogecoin has been drifting downhill ever since its big blow-off peak back in November 2024. Every bounce since then has felt half-hearted, and the brief push in September 2025 fizzled out almost instantly — basically evaporating before momentum even showed up. Earlier this month, DOGE slipped into fresh yearly lows… again.
But over the weekend, something finally cracked the downtrend. DOGE caught a bounce, joining a small memecoin rotation that even dragged Fartcoin (yes, really) back into the green. One of the big sparks? Grayscale’s brand-new Dogecoin ETF, which officially launches today.
ETF debuts are notorious for pulling in institutional liquidity — sometimes only for a short sugar rush, sometimes long enough to flip a trend. Now everyone’s watching to see whether this version boosts DOGE or whether the whole thing fades like the last dozen relief rallies.
Dogecoin ETF Lights the Fuse
From early September, DOGE’s been grinding through a five-wave decline, the final piece forming an ending diagonal — a pattern that traders often see as the “hey, the selling might finally be tired” signal. Ending diagonals show up at the tail end of brutal downtrends, and paired with the ETF launch, it’s enough to get traders leaning forward in their chairs a bit.
Momentum indicators are starting to whisper the same story. The RSI printed a bullish divergence — price made a lower low, but RSI didn’t follow… a classic sign that sellers are running out of juice. RSI creeping up toward the 50 line adds even more weight, since reclaiming that level is usually where early trend reversals begin brewing.
On top of that, the MACD threw down a similar divergence. If DOGE manages to pop out of this wedge — and the setup is tightening fast — traders argue the price could shoot toward the $0.20 zone pretty quickly. That breakout would officially end its five-wave corrective drop.
Short-term memecoin rotations tend to behave like tidal waves: once one token pops, liquidity sloshes into the bigger names, and DOGE is still king of that hill.
But the Long-Term Trend… Still Ugly
Zoom out to the weekly chart and the tone shifts, fast. The long-term structure flipped decisively bearish. In November, DOGE snapped below a massive 763-day ascending support trendline, a line that carried the entire two-year uptrend. Breaking it was a big deal — the kind of break that signals a complete trend change, not a dip.
Weekly indicators aren’t helping either. RSI has dipped under 50, a bearish shift that often comes before deeper corrective waves. MACD has turned negative as well, confirming the trend reversal. If these trend signals keep playing out, DOGE could easily slide toward the $0.115 support area, around 20% lower than current prices and a major structural demand zone.
Why Is DOGE Pumping Right Now?
The weekend bounce wasn’t random. The Grayscale Dogecoin ETF officially goes live today, and ETF launches tend to flood markets with institutional liquidity — at least in the early phases. Pair that with short-term bullish divergences, and DOGE had the perfect setup for a relief spike.
If this wedge finally breaks upward, DOGE could tap $0.20 in the short term. But the long-term picture hasn’t magically changed — the chart still leans bearish, and unless DOGE reclaims key trend levels, the bigger move still points down toward $0.115 in the coming months.
For now, traders are glued to one thing:
Does DOGE break out of the wedge… or break down and continue the long grind lower?