
- Chainlink has dropped back to around $14, landing exactly on a long-term ascending trendline that has triggered every major LINK rebound since mid-2023.
- Short-term charts still show a descending channel from the mid-$20s, but that channel’s lower boundary now overlaps with this multi-year support, creating a high-conviction pivot zone.
- If LINK holds this area, it could rebound toward the mid-$20s again; if the trendline finally breaks, downside opens toward the 11–12 dollar region and a deeper correction.
Chainlink has been sliding for weeks now, drifting lower almost like it’s running out of steam… but this latest drop isn’t just “another red candle.” The LINK price has landed right back on the one level that has defined every major comeback for more than a year. And now that price is sitting on top of it again, traders are suddenly paying way more attention.
LINK Is Touching a Trendline It Has Respected for Years
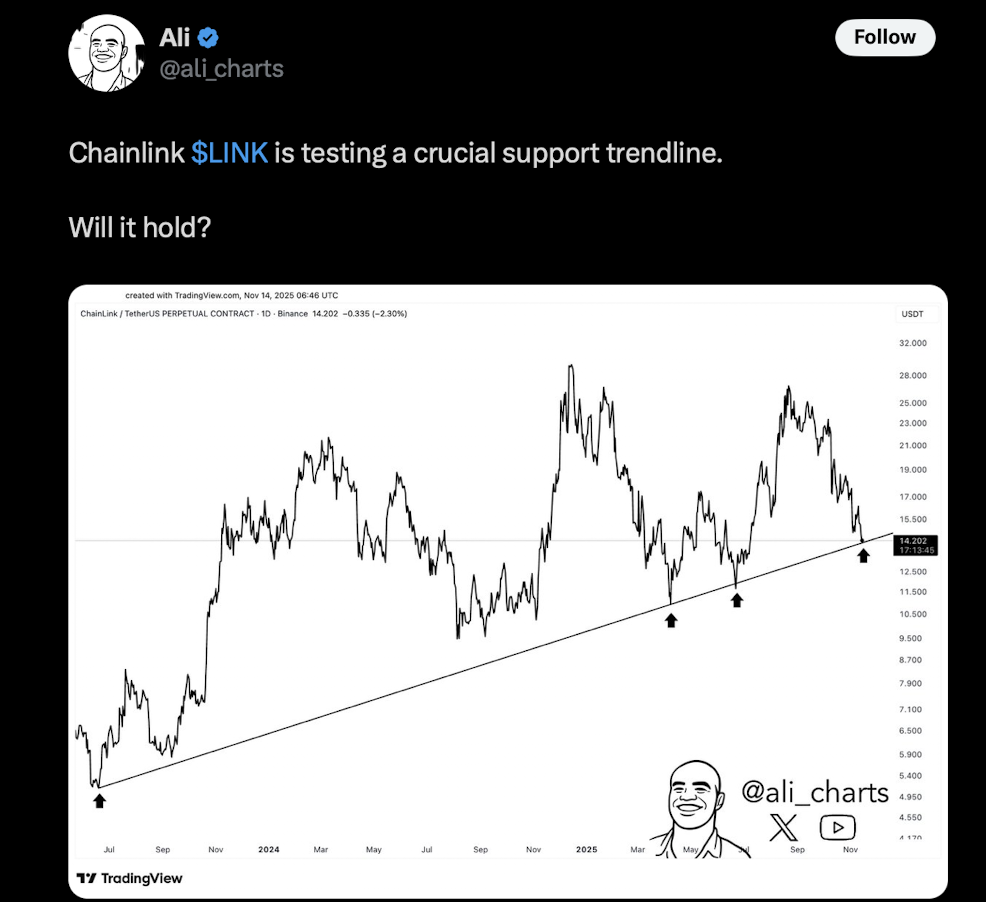
If you take a look at Ali Martinez’s chart, the story becomes pretty clear. LINK is tapping the same long-term ascending trendline that’s held strong since mid-2023. Every time this line was touched, the price didn’t just bounce—it ripped. Sometimes for weeks straight, sometimes for months. Honestly, it’s been one of the cleanest trend supports LINK has ever had.
Right now the LINK price is hanging around the $14 zone, sitting directly on that multi-year trendline. If it holds again, history says LINK could reset its entire bullish structure. If it breaks, well… that would be the first real violation of this pattern in years, and that’s where things get messy.
Short-Term Charts Still Look Heavy, but a Pivot Zone Is Forming
Zoom in to DonaldTrade’s 1-hour chart and the story feels kinda different. LINK has been drifting down inside a wide descending channel, dropping from the mid-$20s all the way back to where it is now. It hasn’t broken that downtrend yet, so short-term sentiment still leans cautious.
But here’s the part that’s actually interesting: the bottom of Donald’s channel lines up almost perfectly with Ali’s big multi-year trendline. When a macro support and a short-term structure collide like this, the zone often becomes a buyer magnet—you’ll see people betting on a bounce simply because the setup is too clean to ignore.
If LINK holds this area, it has room to shoot back toward the upper side of the channel, maybe even revisit the mid-$20s. If bulls fail and that trendline cracks? The next strong support doesn’t show up until around the $11–$12 pocket.
How High Could LINK Go From Here?
The whole play right now hinges on whether LINK can defend that trendline that’s protected it across multiple cycles. If buyers step in again—and they’ve done it every other time so far—another big rebound from this exact zone is totally possible.
But if sellers finally punch through it, the structure opens up for a deeper slide.
It’s a simple setup, but honestly one of the most important ones LINK has faced in a while. This isn’t just any support test. It’s the backbone of the whole multi-year trend. And judging by the speed of this move, the market probably doesn’t have long to wait. The next few days should tell us whether LINK flips or finally breaks.