
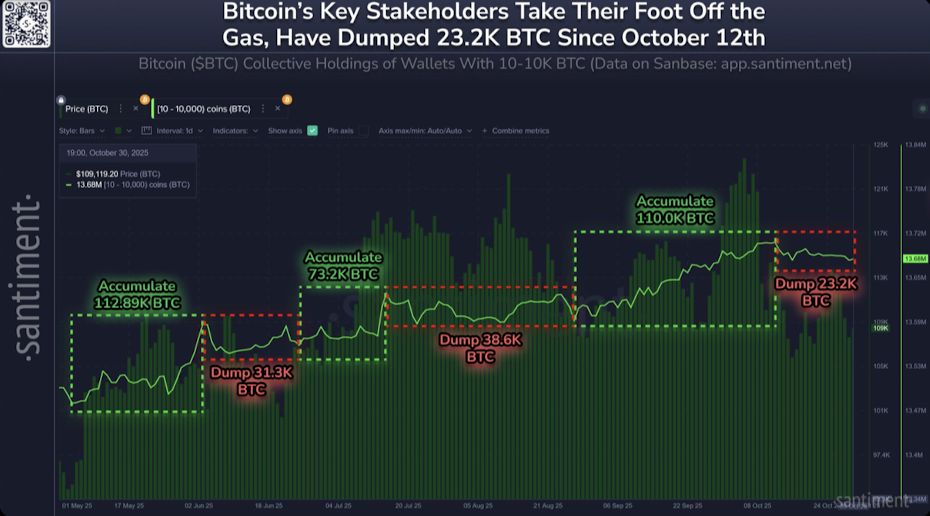
- Whales now hold 68.6% of all BTC, but have sold ~23K BTC since October highs.
- Bitcoin trades near $110.8K, below 20-week EMA but above long-term support.
- Reclaiming $111K–$112K could spark a rally; losing $100.9K risks deeper correction.
Fresh data from Santiment paints an interesting picture for Bitcoin right now. Wallets holding between 10 and 10,000 BTC — often called the “whale zone” — now control roughly 13.68 million BTC, which is about 68.6% of the total supply. That’s a big chunk of the pie. But what’s catching everyone’s attention is their latest move: a small but noticeable sell-off.
Before Bitcoin’s last all-time high, these wallets added around 110,000 BTC between August and mid-October. Since then, though, they’ve offloaded about 23,200 BTC. It’s not panic selling, but it does show a shift in tone — whales are getting a bit more cautious. Historically, that’s the kind of signal that hints at short-term corrections or at least some sideways consolidation.
At the time of writing, Bitcoin’s sitting around $110,795 — just under its 20-week EMA at $111,425 and still comfortably above the 50-week EMA at $100,863. The long-term trend structure is intact and bullish, but you can feel the market’s getting tired after such a strong push. It’s like everyone’s catching their breath before the next move.
Key Levels and Fibonacci Zones to Watch
Bitcoin’s pulled back about 10.6% from its recent high of $123,731, which honestly, isn’t much considering the rally that came before it. The 20-week EMA now acts as immediate resistance near $111K, while the 50-week EMA at $100.8K serves as a strong cushion below. If that fails, the next safety zones are around $84,794 (100-week EMA) and $66,219 (200-week EMA) — deeper correction territory.
Fibonacci retracements line up pretty neatly with this structure too. The 0.236 level near $112,087 is the short-term resistance to beat. A breakout above that would suggest buyers are back in control, opening a path toward retesting the $123K region. On the flip side, losing $100.9K could drag price down into the $84K range, aligning with the 0.382–0.5 retracement zone — where past corrections have tended to find footing.
Market Behavior Suggests a Healthy Cooldown
Zooming in a bit, the Money Flow Index (MFI) reads 43.6 right now — neither hot nor cold. That means we’re seeing light selling, but not the kind that signals panic or exhaustion. Weekly candles are also showing smaller bodies and longer wicks, a visual cue that the market’s in that “wait-and-see” mode.
So, in plain English — Bitcoin’s taking a breather. Buyers are locking in profits, and traders are waiting for a clear direction before jumping back in. If the price can reclaim that $111K–$112K zone and close the week above it, momentum could reignite pretty fast, pushing us back toward $123K. But if we close below $100.9K, that’s where the warning lights start flashing — it’d hint at a medium-term correction phase.
Final Thoughts — Calm Before the Next Wave
At this point, Bitcoin feels like it’s in a calm stretch between storms. Long-term structure? Still bullish. Short-term mood? A bit cautious. Whales are trimming positions, but not fleeing. Indicators are cooling off, but not collapsing. It’s the kind of market that builds tension before the next decisive move.
Whether that move is a push back above $112K or a slide toward $100K will set the tone for the rest of the year. For now, it’s all about patience — because in markets like this, the next breakout (up or down) usually comes when everyone stops expecting it.