
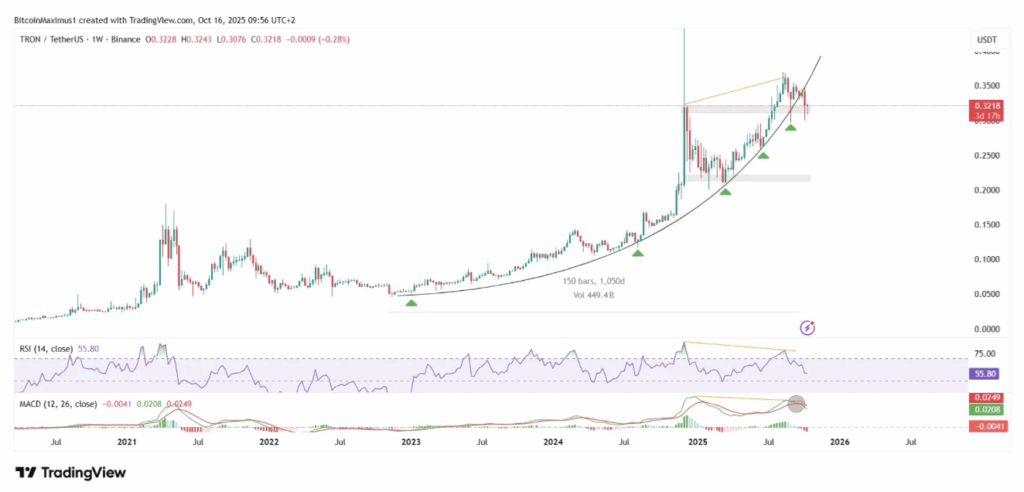
- TRON broke below its 1,050-day parabolic trend line, signaling weakening momentum.
- Key support sits at $0.32 — losing this could open the door to $0.22.
- Momentum indicators and wave patterns point to a possible trend reversal through 2025.
Tron (TRX) seems to be standing right at the edge. After slipping below its long-standing parabolic trend line, the market’s watching closely — and nervously. The token had soared to a fresh all-time high of $0.45 back in December 2024, but that momentum didn’t stick. Since then, the rally has faded, and the price now clings desperately to the $0.32zone — a level that could decide whether TRX stabilizes or slides even deeper.
A Breakdown That Could Change Everything
Looking at the weekly chart, TRX had been climbing along a clean parabolic support line since early 2023. This steady rise helped push the token to its record highs late last year. But like most parabolic runs, it eventually bent under its own weight. After several solid bounces from that same support line, the structure finally gave out last week — ending an impressive 1,050-day streak.
That breakdown came right after one of the biggest liquidation events in crypto history. Typically, when a parabolic base breaks, it signals a much deeper shift in trend. And while TRX hasn’t yet collapsed completely, its safety net is thinning fast. If $0.32 breaks cleanly, things could unravel quickly — potentially dragging prices toward $0.22, a level that hasn’t been tested since early 2023.
Momentum indicators paint a grim picture too. Both the RSI and MACD have printed clear bearish divergences, hinting that buyers are running out of gas. The MACD also confirmed a bearish crossover, a technical red flag that often marks the beginning of a prolonged downtrend.
Wave Count Suggests the Rally Has Peaked
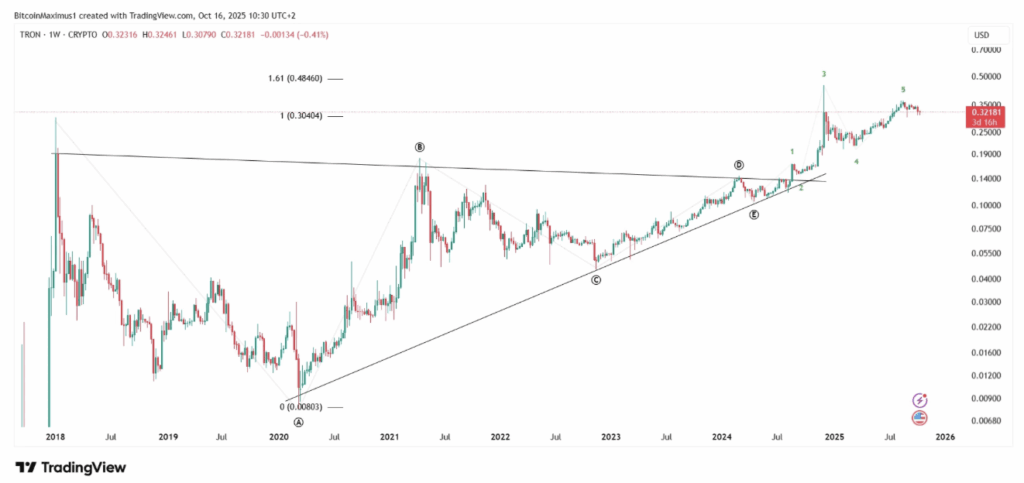
The long-term Elliott Wave structure for TRX supports this bearish scenario. Analysts suggest that TRON’s recent price action completes a five-wave pattern that began after its symmetrical triangle breakout — the same move that led to its last big rally.
Now, with that wave cycle possibly finished, the market could be entering a correction phase that extends well into 2025 or even 2026. While the fifth wave didn’t reach the previous high of wave three, the structure remains intact — thanks to that massive upper wick that capped the earlier move. If this count proves correct, then TRX is likely transitioning from euphoria to retracement mode.
Can TRX Hold the Line at $0.32?
Right now, everything hinges on that $0.32 level. As long as bulls defend it, TRX has a fighting chance to consolidate and maybe stage a slow recovery. But if this floor collapses, the drop to $0.22 could be sharp and unforgiving — confirming that the bull trend has officially flipped.
In short, TRON’s at a crossroads. It’s holding steady for now, but the chart doesn’t lie — pressure’s building, and one wrong move could send it tumbling. Unless buyers step in fast, bears are likely to stay in control heading into the next few months.