- Litecoin price dropped 20%, but on-chain data shows $10.5M in outflows from exchanges.
- Analysts suggest accumulation, not panic selling, as volume and RSI hint at quiet buying.
- LTC could break out of a descending wedge, with a potential long-term target near $650.
Litecoin hasn’t exactly had a smooth week. The price tanked more than 20%, and on the surface, it looks like the market’s starting to give up on it. But, dig a little deeper — especially into the data — and you start to see a different story unfolding. What seems like a bearish collapse might actually be the calm before something bigger.
Smart Money Might Be Loading Up on Litecoin
Market analyst Erica Hazel pointed out something most people are missing. Even though Litecoin’s price fell hard, over $10.5 million worth of LTC was quietly pulled off exchanges this week. That’s not what happens during panic selling — that’s what happens when serious holders start locking in their bags for the long term.
When coins leave exchanges, it’s usually a bullish tell. It signals accumulation, not capitulation. And Hazel didn’t stop there — she noticed trading volume spiked 125%, while the RSI is dipping close to the oversold zone. That combo — dropping price, higher volume, and heavy outflows — tends to show strong hands buying from weak ones.
In her words, it’s a “textbook accumulation phase, not capitulation.”
Take a look at Litecoin’s inflow/outflow chart and you’ll see the same thing: a lot of red bars, meaning more coins are leaving than entering. That’s a quiet but powerful bullish signal.
So yeah, the chart looks scary, but the data? It tells another story — one where smart money’s slowly stacking while everyone else is nervous.
Technical Setup: The Wedge Pattern Could Be the Trigger
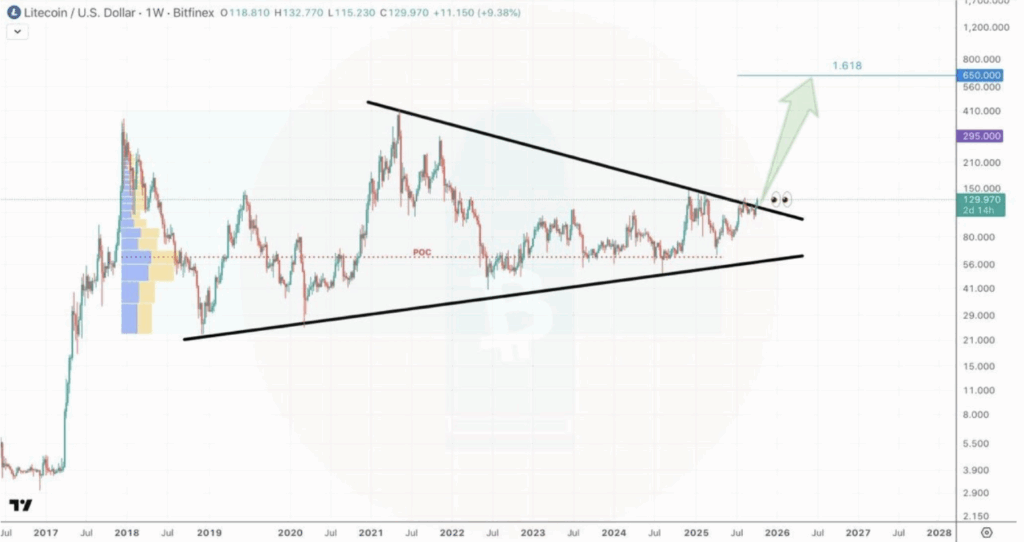
A trader who goes by CustomizedTrader shared something pretty wild on X. His weekly chart shows Litecoin coiling up in a massive descending wedge — one of those patterns that often ends with a sharp breakout.
Right now, LTC is testing that upper trendline between $130 and $150. If it breaks above, the next Fibonacci projection points all the way to $650 long-term.
Sounds far-fetched? Maybe. But Litecoin’s done this before — every major run it’s ever had came right after a long, boring phase when everyone counted it out.
What Comes Next for Litecoin
So yeah, on paper, Litecoin doesn’t look great. The price is down, and the short-term charts don’t exactly scream “buy.” But if you look past the noise — at the exchange flows, RSI, volume spikes, and that big wedge pattern — something different starts to take shape.
It’s possible Litecoin’s just entering an early accumulation phase, the kind that sneaks up before anyone notices. Maybe this isn’t the end of the story — maybe it’s just the setup for the next chapter.