
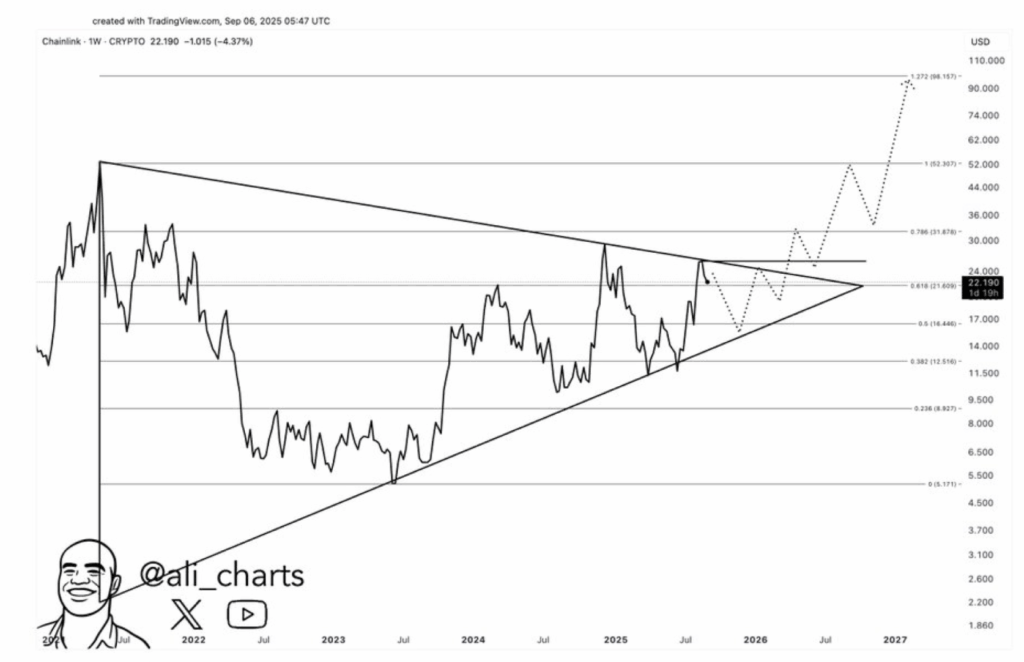
- Chainlink’s price action is tightening inside a massive multi-year triangle, with key support near $16 and resistance at $24.
- Fibonacci levels map out a potential path toward $31, $52, and eventually $98–$100 if bullish momentum holds.
- Analysts say a dip could actually be the most bullish setup, setting the stage for a long-term breakout.
Chainlink might be setting up for one of its biggest moves in years — at least that’s what some traders are starting to whisper about. A crypto analyst, Ali, dropped a weekly chart on X that lays out what he calls the “most bullish setup” for LINK. His roadmap is simple enough: a dip back toward $16 before an eventual run that could stretch all the way to the $100 neighborhood.
At first glance, it looks like just another squiggly chart. But zoom in and you’ll see a massive triangle that’s been forming since 2022, with Fibonacci levels carefully stacked over it. A retest near $16 would line everything up neatly — kind of like a spring coiling tighter before a big snap.
Why Traders Are Eyeing the Triangle
Ali’s chart shows LINK squeezing inside a wide symmetrical triangle, getting closer to its apex. Right now, price sits near $22, brushing up against the 0.618 Fibonacci retracement at $21.61. If it slides down toward $16, that would hit the 0.5 Fib at $16.49, creating a higher low inside the triangle — often a prime setup before liftoff.
The real trigger sits above $24, where a descending resistance line has kept LINK capped. A decisive breakout there would be the first green light.
Of course, this isn’t just chart doodling. Chainlink isn’t a meme coin — it’s a decentralized oracle network, moving off-chain data into smart contracts. That means real-world adoption and usage (like price feeds and external data signals) directly connect to token demand. When adoption climbs, so does the value case for LINK.
Fibonacci Map to $100
Ali’s Fibonacci levels sketch out a clear path. The key numbers:
- Support around $16.49 (0.5 Fib).
- Resistance near $21.61 and $31.88.
- Extensions pointing to $52.31 and $98.16 — practically a bullseye on $100.
His dotted line projection looks like a roadmap: dip to $16, bounce above $24, rally toward $31, then $52, and eventually that magical $98–$100 zone.
But don’t expect fireworks tomorrow. Weekly charts are slow movers, and this setup is more like a rocket countdown than a quick launch. First the triangle squeeze, then the breakout, then stage-by-stage checks at each Fib level. Only after all that could LINK think about touching three digits.
The Big Picture
In simple terms: a dip to $16 isn’t bad news — it could be the exact bullish setup that clears the runway for a long climb. Breakout above $24 opens the door to $31, $52, and maybe, just maybe, $100.
It’s the kind of scenario that reminds traders of past altcoin cycles, where years of sideways compression finally gave way to explosive upside. Whether history repeats for LINK… well, that’s the bet.