
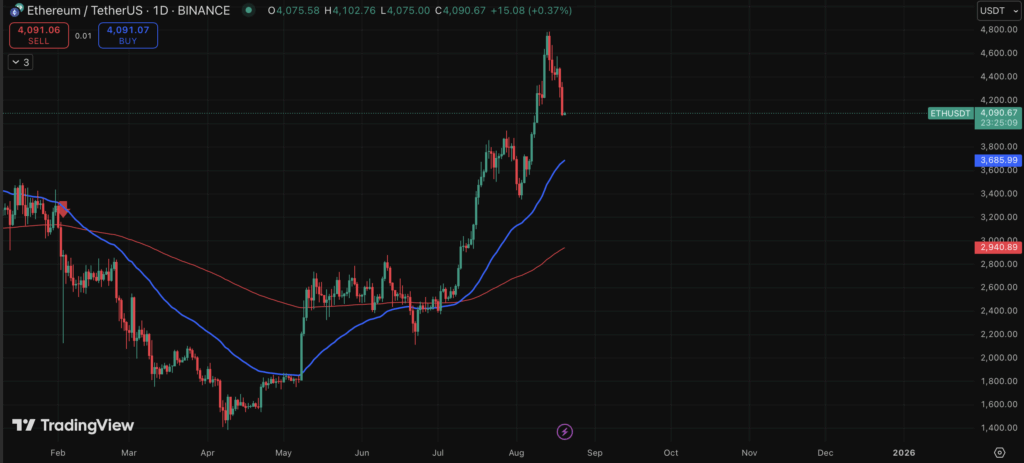
- Ethereum slipped under $4,300, testing support near $4,200–$4,250.
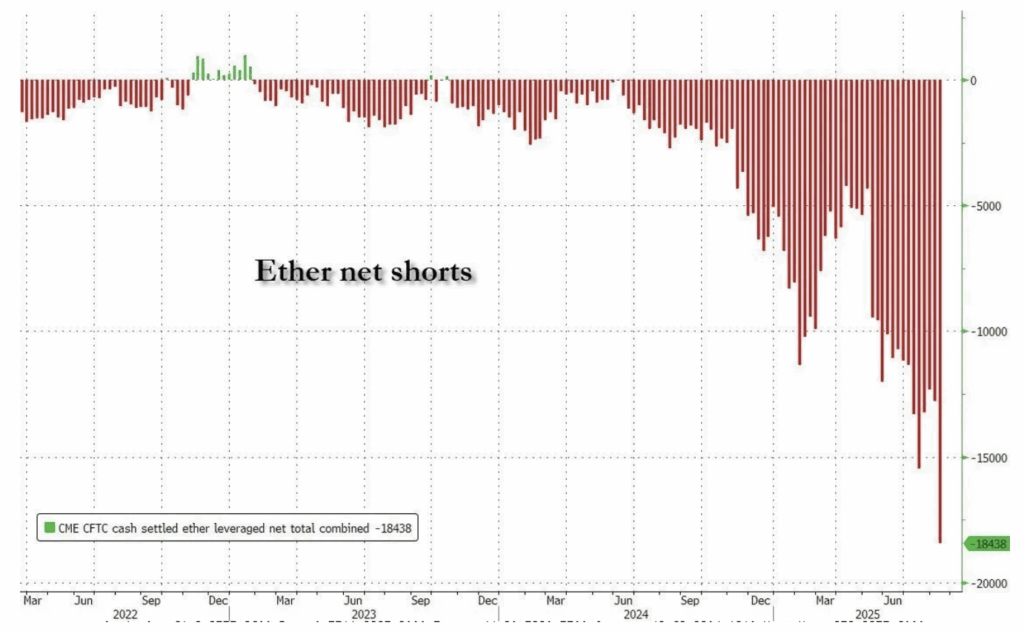
- Record leveraged shorts at 18,438 contracts raise risk of both downside and a potential short squeeze.
- Fundamentals—exchange supply, institutional buying, adoption—still point to long-term strength.
Ethereum has hit a rough patch lately, slipping under the $4,300 mark after weeks of steady gains and multi-year highs. Bulls, who looked unstoppable not too long ago, are now struggling to defend key support zones. Losing that level has traders worried about the chance of a deeper pullback, though it’s worth noting the bigger picture still leans bullish thanks to solid fundamentals.
Institutional demand continues to act as a tailwind, with large firms steadily adding exposure through ETFs, treasury allocations, and direct on-chain buys. This slow but steady accumulation shows confidence in ETH’s long-term role in the crypto ecosystem. At the same time, derivatives markets are heating up, with Open Interest climbing sharply, signaling heavy speculation. While that kind of leverage can magnify moves in both directions, it also highlights the tug-of-war between bulls and bears at these levels.
Record Short Positions Build Up
According to analyst Ted Pillows, Ethereum is now staring down the largest leveraged short position in its history. Net shorts have ballooned to 18,438 contracts, a massive bearish bet fueled by ETH’s drop from $4,790. The market clearly expects more turbulence, with traders lining up aggressive downside plays. But ironically, this build-up of shorts could trigger the exact opposite: a brutal short squeeze if price bounces.
If ETH rallies from here, bears may be forced to cover quickly, pushing prices higher at a faster pace than usual. History has shown these lopsided setups often end in explosive upside moves, blindsiding short sellers. Even with all this short-term noise, Ethereum’s fundamentals—like declining exchange supply, growing institutional interest, and broader adoption—still paint a longer-term bullish outlook. For now, everyone’s watching to see if the record shorts spark the fuel for ETH’s next breakout.
Technical Picture: Testing Key Support
Ethereum is trading around $4,284 and showing some pretty choppy action after dropping back from the $4,800 region. The current battleground is the $4,200–$4,250 zone, which also lines up with the 100-day moving average—a level that’s acted as reliable support during earlier dips. Traders are eyeing this area closely because losing it could open the door to a slide toward $4,000 or even $3,900.
Charts show that buying pressure is still present, but it’s clear sellers are stepping up after weeks of consistent green candles. Volume bars have turned heavy red, underscoring the recent selling wave. That said, as long as ETH stays above its 200-day moving average (near $3,920), the broader uptrend is intact. If buyers can defend the $4,200 demand zone, another rally attempt toward $4,500–$4,600 looks very much in play.
The Bigger Picture
Ethereum finds itself at a crossroads: on one side, record short bets and rising volatility hint at turbulence, on the other, strong fundamentals and institutional appetite keep the bullish case alive. The next few days could be decisive in setting the tone, whether ETH cracks further under pressure or snaps higher in a squeeze. Either way, traders are bracing for fireworks.