- Solana slipped 5.29% in the past 24 hours to $180, but on-chain data shows long-term holders aren’t dumping, with Coin Days Destroyed (CDD) collapsing 86% in a day.
- Exchange balances dropped by over 1.12 million SOL in two days, signaling accumulation or at least no panic selling during the correction.
- Key supports sit at $178–$173; holding here could push SOL back toward $189–$199, but a break below $173 risks weakening the short-term bullish setup.
Solana hasn’t exactly been on fire these past three months, logging a modest 7.9% gain overall. On a month-to-month scale, the move is even thinner—just 2.3%. Nothing that screams bullish conviction. But the flat chart hides something interesting: sharp, quick rallies that flare up, fade fast, and then vanish, leaving traders still watching.
The latest move has been rougher though. After dropping 5.29% in just 24 hours, SOL slipped back to $180, tagging along with the broader market correction. At first glance, the mood looks weak, but dig deeper and you’ll find two on-chain metrics hinting at the same setup that’s preceded past snap-back rallies.
Big Holders Keep Their Coins Quiet
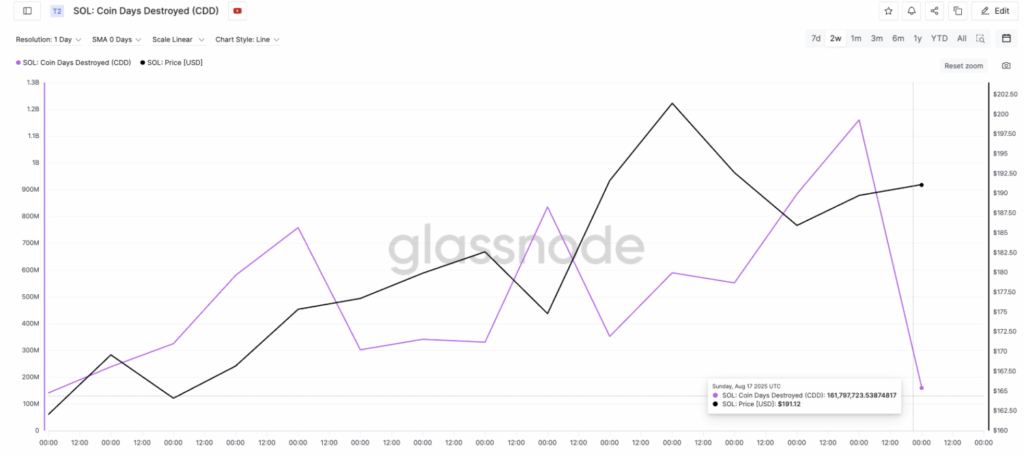
On August 17, Solana’s Coin Days Destroyed (CDD) collapsed to just 161.79 million, the second-lowest daily reading this month. That’s a massive drop from August 16, when it spiked to 1.16 billion. An 86% single-day collapse like this usually signals something important: long-held coins aren’t being sold.
If the old bags were hitting the market, CDD would shoot up instead. What we’re seeing here is the opposite—most of the movement is coming from recently bought or short-held coins. The longer-term supply is staying put. It’s not perfect confirmation just yet, but if CDD stays low without sudden spikes, it could mean big holders are done selling and just waiting.
Earlier in August, similar dips in CDD lined up with consolidation phases that turned into quick rebounds. That’s worth keeping in mind as the chart plays out.
Exchange Balances Point to Accumulation
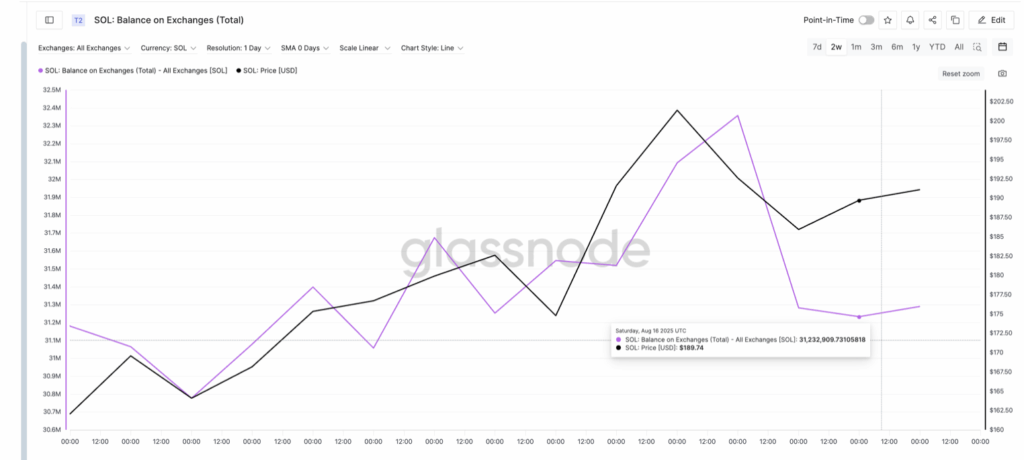
Pair this with exchange balances and the picture sharpens. From August 14 to August 16, total SOL across exchanges dropped from 32.35 million to 31.23 million. That’s over 1.12 million coins—gone from trading floors in just two days. All while price slipped from $192 to $185.
In corrections, you’d normally expect balances to rise, with traders rushing to dump bags. Instead, supply is flowing out, which usually means accumulation or at least no panic selling. Even though balances have ticked up a bit since then, they’re still hanging near recent lows, keeping that accumulation narrative alive.
Technical Levels: Support and Resistance in Play
On the charts, Solana just bounced to a local low of $180.89 after rejecting $189.95 resistance. Right now it’s sitting between two key levels: $178.24 and $173.46, both of which acted as strong reaction points earlier this month.
If these levels hold, SOL could make another push into the $189–$199 band. That zone has already proven sticky and will need a clean break above $199.27 to open the path back toward $209+. But if price slips under $173.46, that short-term bullish case weakens fast.
Takeaway
Solana’s short-term dip doesn’t look like a full-on panic dump. Big holders aren’t unloading, and exchange supply keeps dropping—both signs of quiet tightening. Technical support is holding for now, but all eyes are on whether SOL can reclaim the $189–$199 range or break lower to reset the structure.