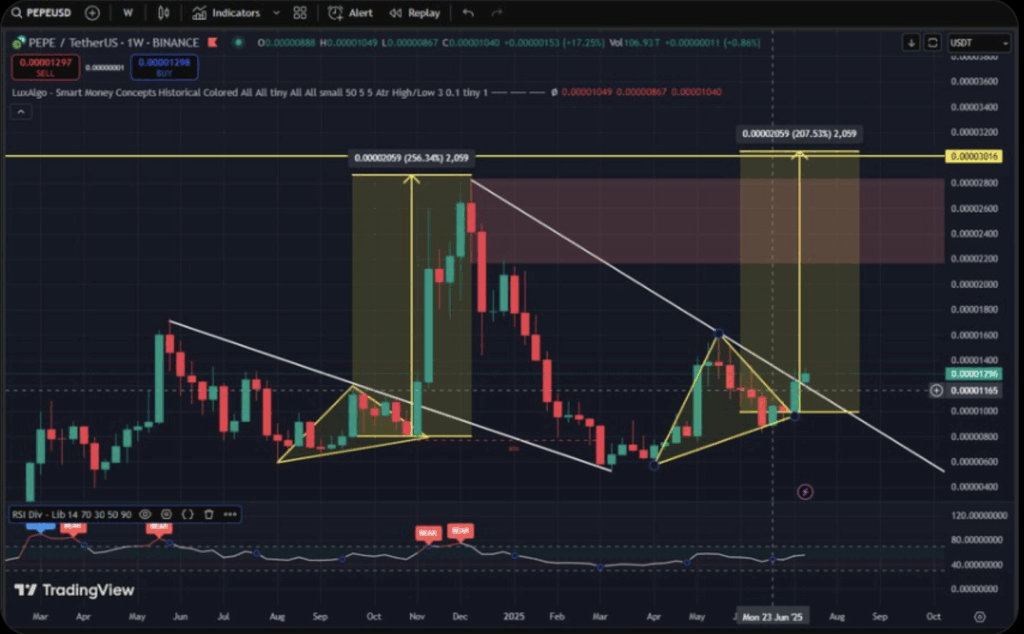
- PEPE Coin just broke out of a months-long triangle pattern—eerily similar to the one before its 256% rally in 2023.
- Key resistance lies at $0.00001364 and $0.00001646, with sell pressure fading near $0.00001250.
- Technicals show bullish momentum building, with MACD and BBP indicators flashing green and daily volume spiking 13%.
PEPE Coin is grabbing attention again after snapping out of a months-long sideways grind. Its weekly chart just flashed a breakout that looks oddly familiar—almost like a copy-paste of what happened before that wild 256% run back in late 2023. Naturally, analysts are watching closely now, eyes glued to resistance zones, volume spikes, and some déjà vu-inducing chart fractals.
That Weekly Pattern Looks Way Too Familiar…
The weekly chart shows PEPE working its way out of a symmetrical triangle—formed over several months—and now breaking above it. Sound familiar? It should. That same structure played out between August and October last year, right before PEPE exploded.
What’s interesting is this: in both cases, the triangle squeezed tighter with lower volatility, all while volume slowly picked up. And just like in 2023, price kept building higher lows. All of that typically signals one thing—buyers are quietly loading up.
Now that PEPE is hovering above the triangle’s apex, this might just be the beginning of a bigger breakout. If momentum holds, it could very well make a run for its old highs around $0.00003016. But first… it’s gotta clear a few hurdles.

Resistance Zones To Watch — $0.00001364 and $0.00001646
On the daily chart, there are two big resistance levels that’ll decide where things go next. The first one’s at $0.00001364—that’s where PEPE got slapped down back in May. This zone has flipped roles a couple of times (from support to resistance), and price is now approaching it again.
Next stop? $0.00001646. That level came from a peak in early June and happens to line up with an old liquidity gap, so there could be some sell pressure lurking there. If PEPE blasts through both zones, though? Yeah… we might be staring down a new all-time high soon.
That $0.00001250 Sell Wall? It’s Getting Weaker
Now, there’s a cluster of sell orders crowding around $0.00001250. It’s been a sticky area recently—price has bumped into it multiple times. On-chain order books show a fat supply wall right there, but here’s the thing: every time PEPE tests it, volume ticks up and pullbacks get shallower.
That usually means buyers aren’t backing off. So, if price finally slices through this wall cleanly, there might not be much resistance left until it smashes into those higher targets.
Technicals Are Pointing Up — MACD, BBP, and Momentum
From a indicators perspective, things are lining up nicely. The daily MACD just flashed a bullish crossover, with the MACD line pushing above the signal line. Histogram’s looking healthy too—it just flipped positive, which suggests buying pressure is growing.
And check this—Bull Bear Power (BBP) also turned green. That means bulls are flexing a bit more muscle now, and the matching rise in price only confirms the vibe: this trend still has gas in the tank.
Right now, PEPE’s trading around $0.00001328, up 20% on the week. The token keeps making higher lows—classic sign of a short-term uptrend. Add in a 13% jump in daily volume (now sitting at $2.22 billion), and yeah… things are heating up as price flirts with that $0.00001350 resistance.


