
- Long-term holders aren’t selling, and the MVRV ratio shows there’s room for more upside before major profit-taking.
- Technicals are bullish: ADA just completed a triple EMA crossover and is aiming to break the $0.86 resistance level.
- RSI divergence hints at a short-term pause, but unless major selling kicks in, ADA still looks strong for another breakout.
Cardano’s stalling a bit under $0.86—but don’t blink. With several bullish signals flashing across the board, this might just be a short pit stop before ADA kicks up toward $1… maybe more.
Old Wallets Stay Quiet, and That’s a Good Thing
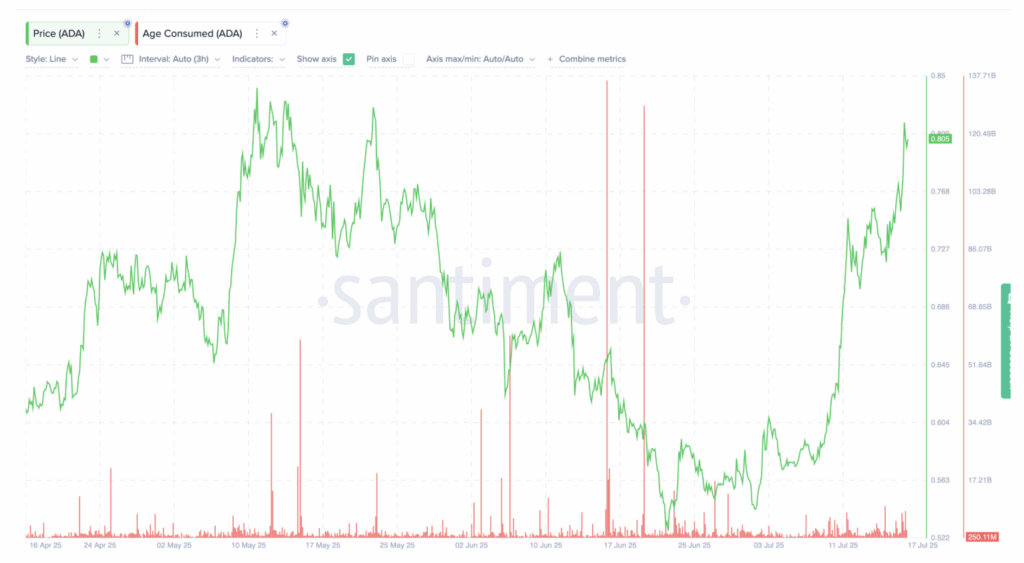
So here’s the deal: even after the recent price run-up, we’re not seeing old ADA tokens getting shuffled around. The Age Consumed chart hasn’t budged much since mid-June, when a big spike showed over 130 billion aged ADA moved. Right now? Just sitting around 250 million. Pretty chill.
In plain terms, this means long-term holders are holding tight. No panic selling. No mad dash for exits. That usually hints they believe more upside’s coming.
MVRV Ratio Shows Room to Run
It’s not just old holders. Even newer buyers—folks who hopped in the past couple months—aren’t rushing to take profits. The 60-day MVRV ratio is hanging around 22.91%. Compare that to mid-May, when it soared past 131% right before the selloff. Different story now.
Back in April, this same metric was in the 20s too—and ADA still pumped over 35%, jumping from $0.62 to $0.85. So history says this ratio might be low enough for another strong push.
What is MVRV, anyway? It tells us if recent buyers are sitting on big profits. If they’re not, they’re less likely to bail. And right now, seems like that’s the case.
EMA Crossovers Are Lighting Up
Now for the technical geeks—Cardano just did something pretty rare on the charts. The 20-day EMA has now crossed over the 50-day, 100-day, and just earlier today, the 200-day. That’s what traders call a triple golden crossover. Doesn’t happen often, and when it does? Usually means the trend is picking up serious steam.
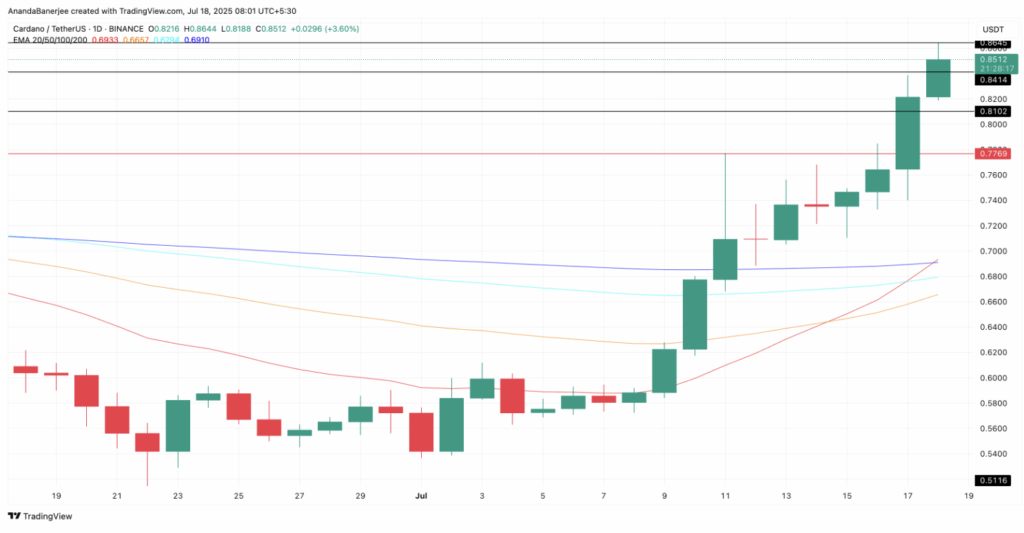
One Last Wall: The $0.86 Barrier
Right now, ADA’s trying to break past that pesky $0.86 resistance. It’s not random—that level matches up with the 1.0 Fibonacci retracement from the May peak. If it gets through, the next target lines up at $1.07, based on the 1.618 Fib extension. Pretty technical, yeah—but a big deal for chart-watchers.
That said, there’s a small hiccup. The RSI is throwing off a bearish divergence. Price is moving up, but RSI’s making lower highs since July 11. Sometimes that signals a slowdown. Doesn’t always mean a reversal, but it could lead to a bit of a breather before the next leg.
If ADA slips under $0.78, that could invalidate the bullish setup short-term. But unless we see long-term holders suddenly offloading—which the data doesn’t suggest—it still looks like this rally’s got legs.