
- Hidden bullish divergences on the 1-hour chart hint at a potential continuation of the uptrend.
- BNB is consolidating with steady volume, showing signs of gradual accumulation rather than hype-driven spikes.
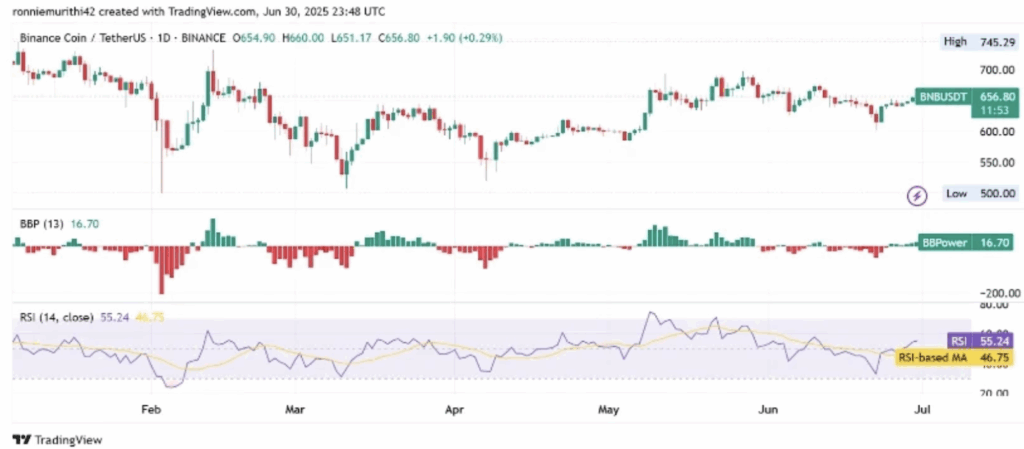
- Technical indicators (RSI, BBP) are turning positive, putting a breakout on the table if resistance breaks cleanly.
BNB’s been quietly holding its ground, managing to stay firm even as the broader crypto market’s been doing its usual dance. Over the last 24 hours, price action was… well, tight. But not in a bad way — more like calm before the next move.
By the end of July 1st, BNB had notched a 1.01% gain, closing out at $654.51. It’s not a huge jump, sure, but that steady climb — paired with some key technical signals — has traders thinking something bigger could be brewing.
Divergences Point to Continuation, Not Collapse
A recent post by @WhiteboxTrading on X (yep, still calling it X) flagged a hidden bullish divergence on the 1-hour BNB/USDT chart. Basically, price printed a higher low, while the RSI showed a lower low. That’s usually code for: “this trend might keep going.”
And wouldn’t you know it, BNB popped shortly after that divergence formed. Clean, textbook stuff.
Interestingly, that came not long after a bearish divergence earlier in the month — you know, one of those “higher highs on price, lower highs on RSI” type setups. That one led to a bit of sideways chop before buyers stepped in again. Since then, there’ve been two more hidden bullish signals (June 26 & 29), both adding fuel to the trend.
BNB tagged $656 during the mini-surge, a level that now looks like a short-term ceiling. Still, holding above $650 is a win for bulls.
Data Shows Cautious Accumulation — Not Hype
According to Brave New Coin, BNB’s market cap sits at a comfy $95.5 billion, with just under 146 million tokens floating around. Over the last 24 hours, price bounced between $652 and $658 — pretty chill range, but steady volume suggests folks are still paying attention.
Volume clocked in at $453.76 million, but things really popped late June 30th with a $743.83 million surge. Price moved up, dipped a bit, then landed around $654. That spike? Might’ve just been some short-term profit taking, nothing too dramatic.
Also, @cryptozone_x flagged a liquidation alert on X — $91K in shorts closed at $657 on Bybit. That’s usually a sign of some buy pressure kicking in, squeezing out overleveraged bears.
Technicals Hint at a Breakout… Maybe
On the daily chart, BNB finished June 30th at $656.91, up just a hair — 0.31%. The high was $660, low was $651. Not wild volatility, but there’s a subtle shift happening.
BNB’s been range-bound since May, chilling between $500 and $745, but now it’s poking the upper half of that range. Bollinger Band Power flipped positive recently, hitting 16.67 — a notable shift after spending early 2025 mostly in the red.
That alone doesn’t scream “moonshot,” but it does suggest growing strength. RSI is sitting at 55.3, while the moving average is lagging behind at 46.75. RSI crossing above its MA? That’s usually a low-key bullish sign.
So yeah — if BNB keeps pressing on and clears the local resistance, we could see it stretch toward $700+ again. But it’ll need some volume support and no sudden market meltdowns to get there.