- SOL is flirting with $150 but facing serious resistance—$144–$146 could be the make-or-break zone.
- Derivatives data still leans bullish, but overexposed longs could trigger sharp drops if price slips.
- Despite short-term warnings, Solana’s still up 17% on the week—momentum’s there, but it’s fragile.
Solana’s been floating just above $150 over the past 24 hours, but the price action feels… twitchy. Traders have started leaning on support levels in the $144–$146 range, as technicals hint at a short-term cooldown. And with the mood shifting, analysts aren’t totally convinced the bulls are in control here.
One of the loudest warning signs? A sell signal from the TD Sequential indicator—yeah, the kind that usually flashes right before a local top. Add that to some fresh Elliott Wave analysis, and there’s now more chatter about a possible pullback than continuation.
Solana Rejected at Resistance—$146 Becomes the Line to Watch
According to Ali Martinez, SOL started showing cracks near $152–$153. That TD Sequential “9” candle hit right around the $152.68 Fib extension—aka tough resistance territory. Since then, price has slipped to about $149.50, and there’s talk it could retest $146 sooner rather than later.
Martinez highlighted $146 as the next key level, both technically and psychologically. It’s where the last consolidation happened, so if bulls can’t hold the line, things could slide to $142 or even $138. A close below $146 on the daily? That’d likely shift sentiment into full bearish mode.
Wave Count Still Bullish—But Correction Might Not Be Done
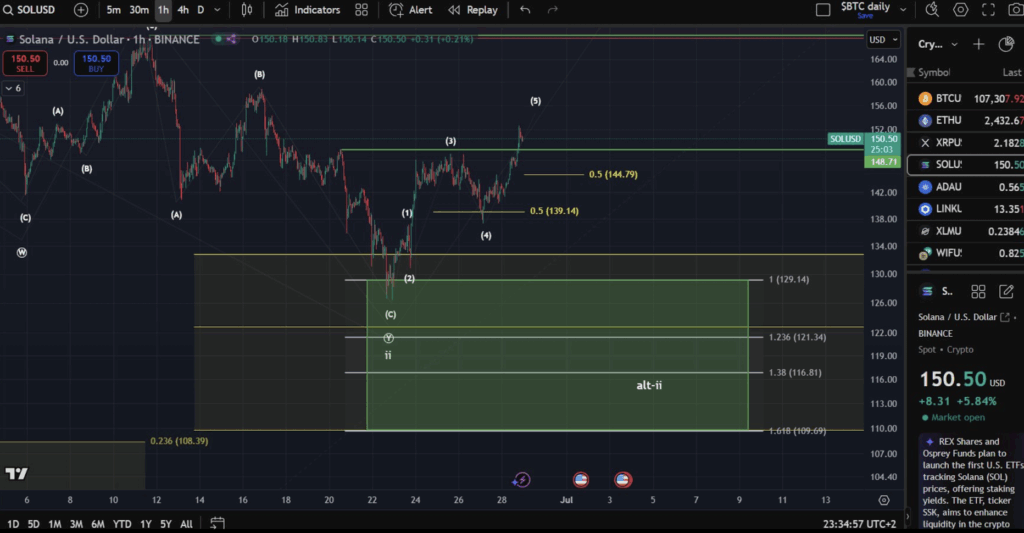
Meanwhile, Man Of Bitcoin posted an Elliott Wave breakdown that backs up the retrace theory. According to the chart, SOL completed a clean five-wave push from its June lows. Wave-(3) topped near $150, wave-(4) fell to $130, and now wave-(5) seems stuck around $150–$153.
He pegged $144.79 as micro support. If Solana can bounce there, it could go after $156–$160 next—that’s the next big Fib target. But if $144 breaks down, that fifth wave might not complete… and we could be staring at $138 instead.
Derivatives Are Still Bullish—But Maybe Too Bullish?
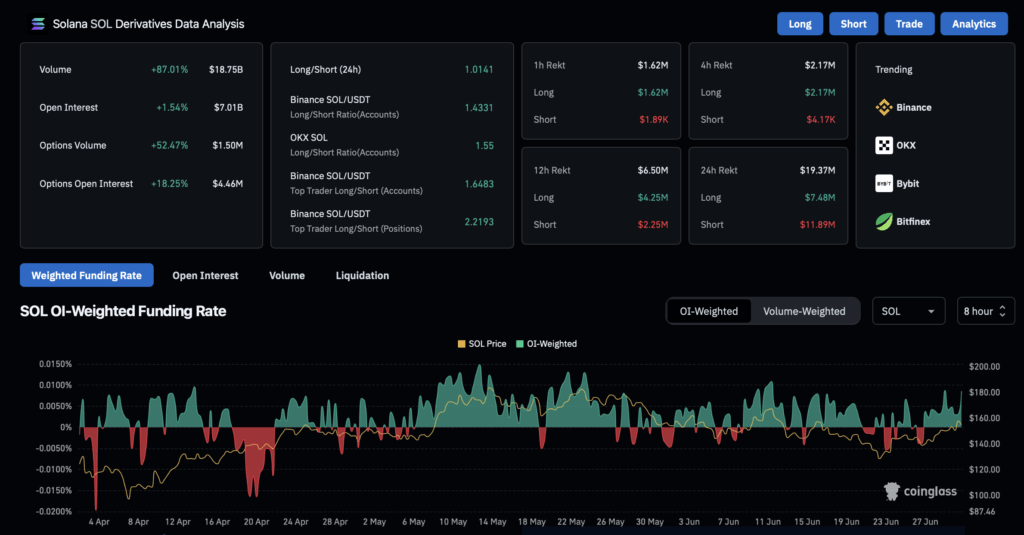
CoinGlass data shows the crowd’s leaning long. Open interest’s up 6.8% to $7.07B. Options open interest? Up over 21%. But here’s the twist—options volume tanked 59%, meaning traders are active, but not super convinced.
Long/short ratio is still positive at 1.0691, and Binance’s top traders are really long—2.03 to 1. But that heavy long positioning? It’s risky. One sharp dip and we could see liquidations domino. Funding rates are flat though, so the market isn’t overheated just yet.
Shorts got wrecked earlier—$190K liquidated in an hour, $468K over 12. But if SOL drops under $148, the squeeze could flip, and it’s longs who might get caught this time.
Volume Drops, Retracement Looms
Solana’s 24-hour volume fell 30% to $1.98B. That’s not a great look. Momentum is fading a bit, just as key resistance holds. Between the TD sell signal, wave count stalling, and dropping volume—it all points to a likely pullback into that $144–$146 range.
Rekt data also showed $9.3M in liquidations in just one day, mostly shorts. So bulls are still pushing… for now. But if $146 cracks? Look out for $138. And if things get ugly, $131.11 could be in play—the 2.236 Fib extension sits right there.
Still, SOL’s up over 17% in the past week, climbing from $129 to $151.6. That kind of move shows strength, even if we’re due for a breather. Whether this is just a pit stop or the start of a bigger slide depends on how well $146 holds up in the coming days.