
- LINK’s recent bounce might be losing steam as dormant wallets and exchanges show increased selling activity.
- Development is slowing, and there’s been no major network-wide accumulation.
- Resistance looms at $13.4 and $14, hinting that LINK could be due for another pullback.
Chainlink (LINK) has been one of the better movers lately, scoring a solid 13.2% gain this past week. Not bad at all. But don’t let the green candles fool you—things haven’t exactly been smooth sailing. Just ten days ago, LINK tumbled from $13.38 down to $10.94 in a sharp three-day drop. That slide came right after Bitcoin nosedived to $99k, thanks to mounting chaos between Israel and Iran and a U.S. airstrike on Iran that rocked the market.
Since that shake-up, crypto sentiment has managed to recover a bit. Prices bounced, traders got hopeful—but when it comes to LINK, something still feels… off. Especially with on-chain data showing another wave of token movement. And not the good kind. That kind of activity tends to scream “short-term top.”
Development Slows Down, But Not All Hope Is Lost
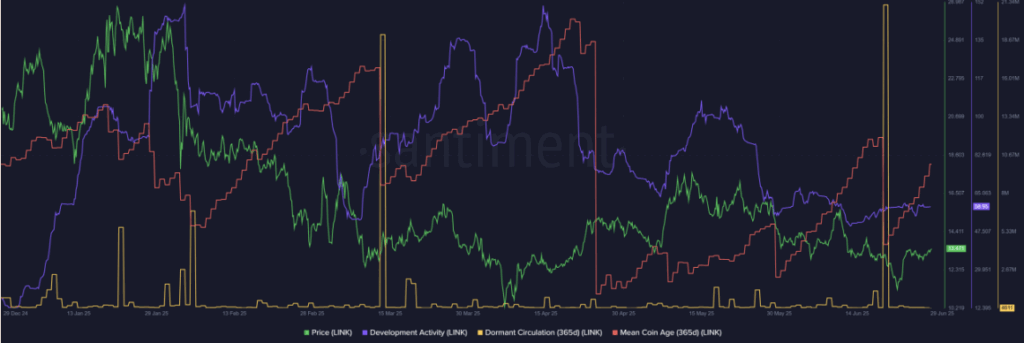
Chainlink has always flexed pretty strong when it comes to developer activity—one of the more consistent DeFi projects on that front. But since mid-April, things have been trending down. It’s not a total collapse, more like a slow leak. Still, compared to most altcoins, it’s holding up okay. That said, it’s definitely enough to give some long-term holders pause.
What’s more concerning? The constant selling pressure every time LINK gets close to the $12 support. Back in March, dormant circulation—a metric that tracks movement from long-inactive wallets—spiked like crazy right at that level. Then it happened again on June 20 as price started sliding near $11. Basically, people who were sitting on their bags decided to cash out. Not exactly a sign of conviction.
Accumulation? Yeah… Not Really
Another worrying trend: mean coin age hasn’t budged. That means there hasn’t been much in the way of accumulation across the network. Folks are buying, sure—but they’re also selling the moment price hits a semi-decent level, like $16. And when it dips near the lows, there’s panic. Classic weak hands behavior, honestly.
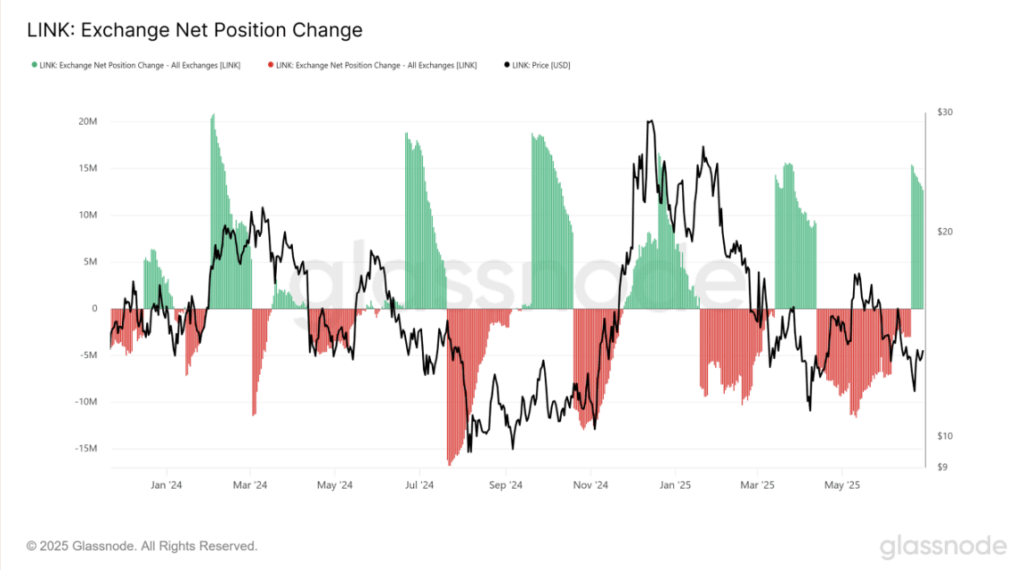
Then there’s the exchange net position change metric—which shows how much LINK is being sent to exchanges. More inflow usually means people are prepping to sell. That indicator turned positive again on June 20, right as prices were sliding. Not exactly a coincidence. In fact, this metric has been flashing red flags since late 2024. Even that mini-rally to $15.5 back in March got smacked down by heavy selling.
Price Hits Resistance—And Might Be Topping Out
Right now, LINK is testing resistance at $13.4. Next stop? $14—another sticky zone loaded with sellers. Given the on-chain signals and recent behavior from holders, this rally’s feeling a bit top-heavy. Unless sentiment or demand flips fast, we might be staring down another short-term top.