- ADA is hovering near $0.6473, testing the base of a descending channel
- $0.47 acts as a key support level, with potential upside to $0.75 if it holds
- Breakdown below support could send ADA to the $0.41–$0.43 range
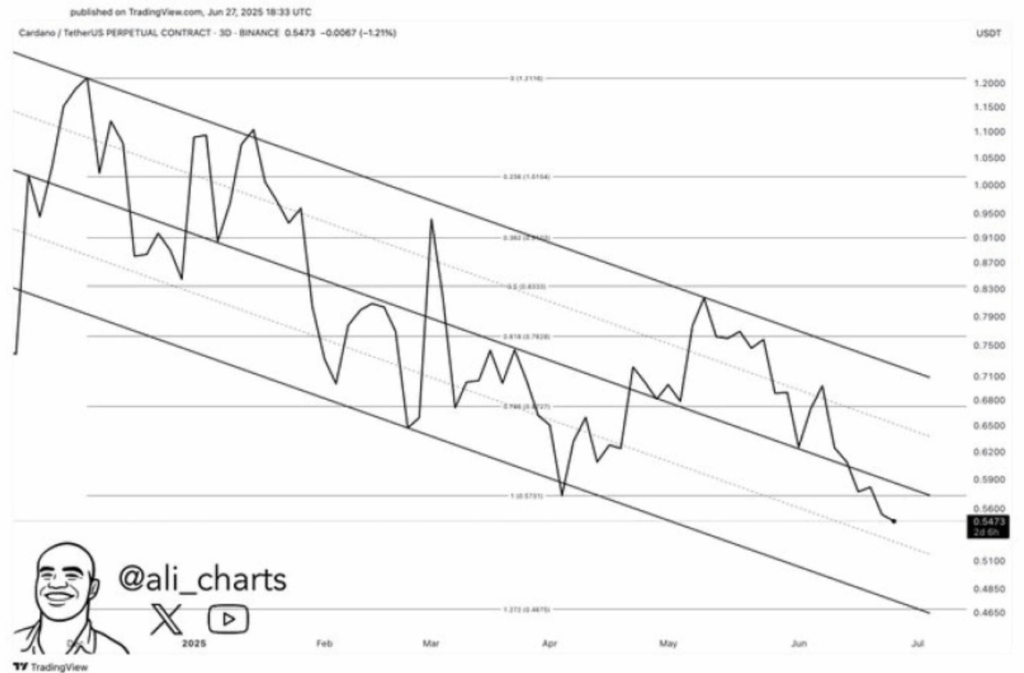
Cardano (ADA) has been struggling to keep its footing lately. The altcoin’s been slipping since the start of 2025, and now it’s staring down the lower edge of a descending price channel. According to a chart from trader Ali (@ali_charts), ADA is approaching what could be a do-or-die moment on the charts—and yeah, it’s getting tense.
Testing the Bottom, Again
Right now, ADA’s trading around $0.6473, dragging its feet near the bottom of a multi-month bearish channel. It already busted through the 0.618 and 0.786 Fibonacci retracement levels, which ain’t the best look. That leaves the 1.618 Fib extension down at $0.4711 as the next major level to watch. It’s a zone that might either save the trend—or sink it.
Technically, assets often get bouncy near the lower edge of these kinds of patterns. And with RSI showing ADA as oversold and volume still dragging, a short-term relief rally wouldn’t be out of the question. That’s assuming it doesn’t completely lose its grip first.

$0.47 – The Big Line in the Sand
If ADA can hold $0.47? Well, that’s a potential springboard. The price could rebound and chase resistance near $0.70 or even $0.75. That’s roughly a 30% climb if things play out well. But—yeah, there’s always a but—if it slips under $0.47 and keeps falling, the next stop might be somewhere between $0.41 and $0.43. Not ideal for holders already underwater.
The next weekly candle close might tell us everything. Stay above $0.47, and bulls might breathe again. Lose it, and the bears get a fresh reason to celebrate.
Final Thoughts
Cardano’s at a tipping point. The $0.47 zone is acting like a hinge for the whole market mood around ADA. A solid bounce could reset sentiment, maybe even draw in some new buyers. But a breakdown? That could mean a painful slide into new lows. Either way, keep a close eye on volume, RSI signals, and where the next weekly close lands.


