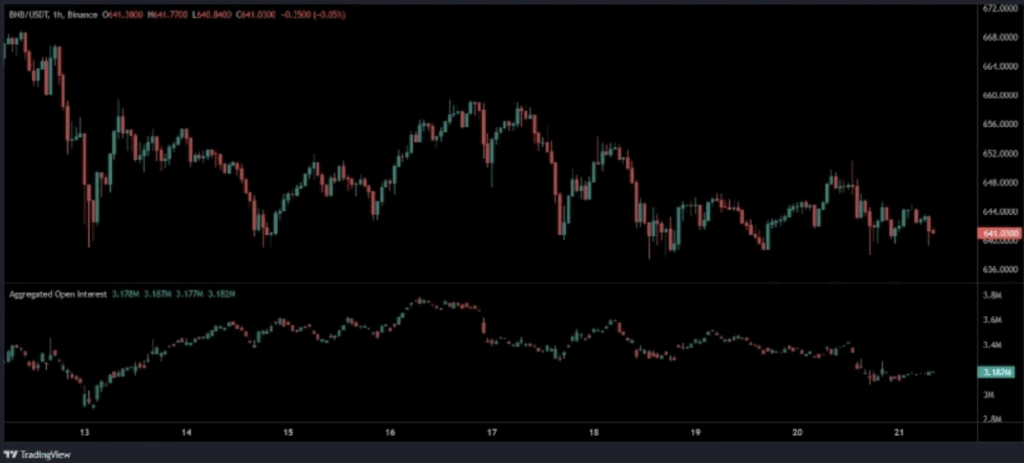
- BNB is consolidating between $638–$648 with stable open interest, suggesting accumulation.
- A bullish MACD crossover and holding RSI point to early momentum, but volume is key.
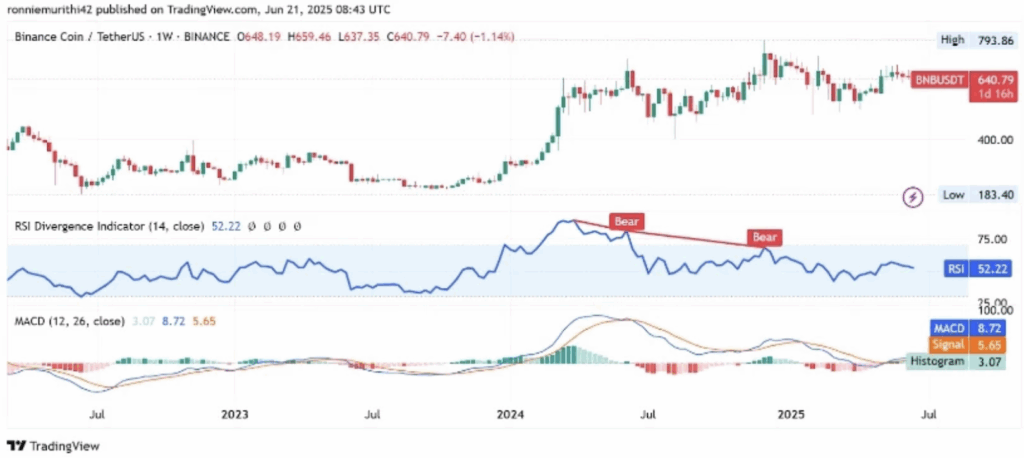
- Weekly charts show structure intact — $650 remains the key breakout level to watch.
BNB’s been tightening up. After a shaky drop earlier in the week, things are starting to settle—and traders are watching closely. With a cocktail of steady open interest, multi-timeframe support zones, and a sneaky MACD crossover, momentum might be tilting in the bulls’ favor. Slowly… but maybe surely.
Support Holds, Open Interest Steadies — Accumulation in Play?
Looking at the BNB/USDT one-hour chart, price is holding up around the $638–$640 zone after dipping below $645. That range has shown some backbone, acting as support through multiple sessions now. Recent candles are short-bodied—classic sign of market indecision. And that usually means something’s brewing under the surface.
Open interest has also leveled out—sitting at 3.18 million after getting wiped midweek. No big spikes, no dramatic exits. Just… flat. And when open interest flattens while price holds steady? That can be a sign traders are quietly accumulating, loading up before a move. No fireworks yet—but the fuse might be lit.

MACD Hints at Reversal — But Volume’s Still the Missing Piece
Now here’s where it gets interesting. 365TradeView flagged a bullish MACD crossover on the 1-hour chart—not far from the zero line. It’s not explosive, but it’s a shift. The histogram’s fading from dark to light magenta, hinting that sellers might be losing steam.
BNB is currently priced at $641.07, down 1.27% on the day. Not exactly thrilling, but sometimes stability is the setup. Volume’s sitting above $710 million. That’s not small change. If we get a push through $646–$648, it could trigger a climb back toward $660. All eyes are on $650—it’s the pressure point bulls need to flip to get the trend rolling again.

Weekly Chart: Still in Range, Still in Control?
Zooming out, BNB’s weekly structure hasn’t broken down. Not even close. It’s been living in this big consolidation channel for most of 2025, stuck between the $640 support and an upper ceiling near $793. The last weekly candle was red, sure, but the big picture still favors the bulls—especially after that long climb out from the $183 lows back in the 2022–2023 cycle.
The RSI is at 52.22—hovering above neutral. There’s been some bearish divergence lately, which usually means choppy, sideways price action. Not the end of the world. The RSI’s still above 50, so there’s no real breakdown yet.
Meanwhile, weekly MACD still looks solid. The MACD line sits at 8.72, signal at 5.65, and histogram at 3.07. Momentum is gentle, not aggressive, but it’s holding. And more importantly, it’s holding above zero.
Final Take: $650 Is the Test
Right now, Binance Coin’s not exactly screaming higher—but it’s also not breaking down. The structure’s stable. MACD’s leaning bullish. And if bulls can reclaim $650, the short-term narrative could flip in their favor.
But here’s the thing: if price keeps grinding without volume or breaks down below $638, all bets are off. For now, though? The pieces are there. It’s just a matter of whether the spark shows up to light the move.


