- BNB is stuck in a tight range between $645–$650, showing signs of a possible breakout if it can push past the stubborn $670 resistance level.
- Momentum indicators like MACD and RSI are turning bullish, but low volume and cautious trader sentiment are keeping things in limbo for now.
- If BNB clears $670 with strong volume, it could rally toward $700+, but a drop below $625 might drag it back into a deeper consolidation.
Binance Coin (BNB) has been kinda stuck lately. It’s bouncing inside a tight range, and while there’s no big move yet, the charts are starting to flash some interesting signals. After that rough correction earlier in June, the token’s been stabilizing—but don’t let the calm fool you, something might be brewing.
Despite the trading volume being a bit meh, BNB seems like it’s gearing up for a bigger move. That $670 resistance zone is key. If bulls manage to shove past it, we could see some nice upside. But if not? Well, back to sideways we go.
After the Drop, a Breather
Looking at the 1-hour chart, there was a pretty aggressive drop on June 5—from around $660 down to $625 in no time. That move also wiped out some leveraged traders based on the open interest dipping hard. Probably some liquidations there. But interestingly, BNB bounced back fast, reclaiming the $650 zone. That recovery didn’t come with a jump in open interest though, which means spot buyers likely stepped in, not the apes on leverage.
Now, as of June 7, BNB is just chilling between $645 and $650. Not much action, no clear trend, and traders seem to be waiting on some kind of catalyst to stir things up.

Volume Slumps as Traders Wait and Watch
Over the last day, BNB’s only nudged up by like 0.22%—it’s now around $650. Price spiked a bit to $653 but couldn’t hold. Typical indecisive stuff. Volume’s also way down, sitting at about $875 million, which is well below its usual $1.5–$2 billion range. Translation? People are hesitant. Maybe they’re waiting on news or just taking a breather.
That being said, BNB still holds its heavyweight status, ranking 5th in market cap, with over $94.8 billion backing it. And don’t forget its tokenomics—those quarterly burns and Binance utility still give it some strong long-term fundamentals.
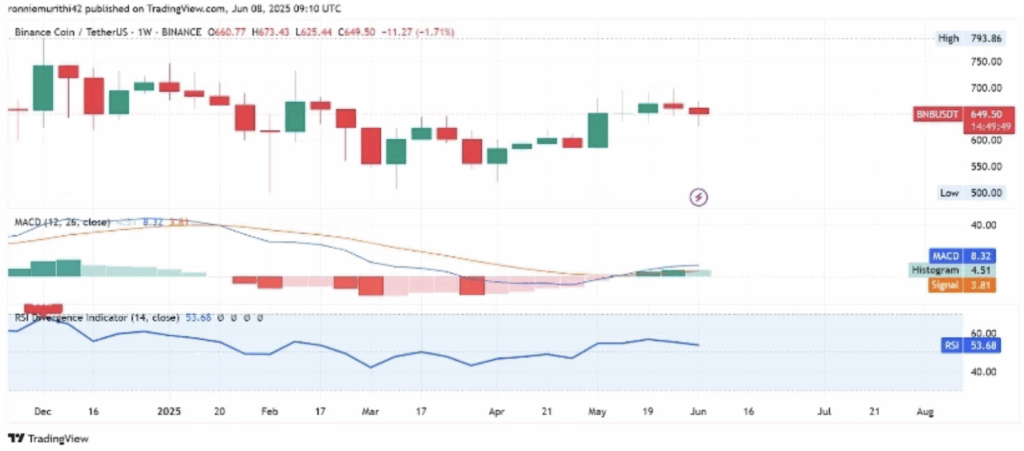
Weekly Chart Hints at a Possible Comeback
Zooming out to the weekly chart, things start to look a little better. Price is hovering around $650, down about 1.6% for the week. Still, the $670–$680 range has been a brick wall for bulls, while $625 seems like solid support.
Candles have been kinda boring lately—short wicks, mixed colors, classic sideways chop. But that could mean we’re in a base-building phase. The MACD is flashing a bit of hope, with a fresh bullish crossover and histogram moving into positive territory. It’s early, but it’s something.
RSI’s at 53.75—not exciting, but not bad either. It’s above 50, and climbing, which hints that buyers are slowly regaining strength. If it pushes past 60 with a pop in volume, that could be the green light for a bigger breakout.
Outlook: Eyes on the $670 Line
Bottom line—BNB is stuck, but not dead. The momentum indicators are whispering bullish things, but until price breaks above $670 with strong volume and rising open interest, it’s just noise. If it happens, $700 or even $740 could be in sight. But if it drops below $625, expect more chop or a deeper pullback.
For now, everyone’s watching and waiting. Let’s see who blinks first—bulls or bears.