
- Bitcoin’s recent bounce to $104K may just be a retest of a bearish breakdown.
- Technicals show a head-and-shoulders pattern, pointing to possible drops to $100K or even $95.5K.
- BTC must break above $107K to shift back toward a bullish trend.
Bitcoin may still have a strong long-term outlook, but its short-term momentum is painting a bleaker picture. After dipping as low as $104.30 overnight, BTC has bounced back near the $104,000 mark, helped by a lift in U.S. equity futures. But beneath the surface, the technical charts are flashing warning signs that this rebound could be temporary.
Breakdown Pattern Suggests More Downside Ahead
The hourly chart shows Bitcoin recently fell out of a head-and-shoulders pattern, a classic sign of a trend reversal from bullish to bearish. What looks like a recovery may actually be a simple retest of the breakdown point—the “neckline.” This is a common move, often caused by early short-sellers taking profits and late sellers joining in, which usually leads to a second leg down.
Key Levels to Watch: $100K Support and $107K Resistance
If Bitcoin can’t hold the line, immediate support sits at $100,000, with a deeper drop potentially targeting $95,500.
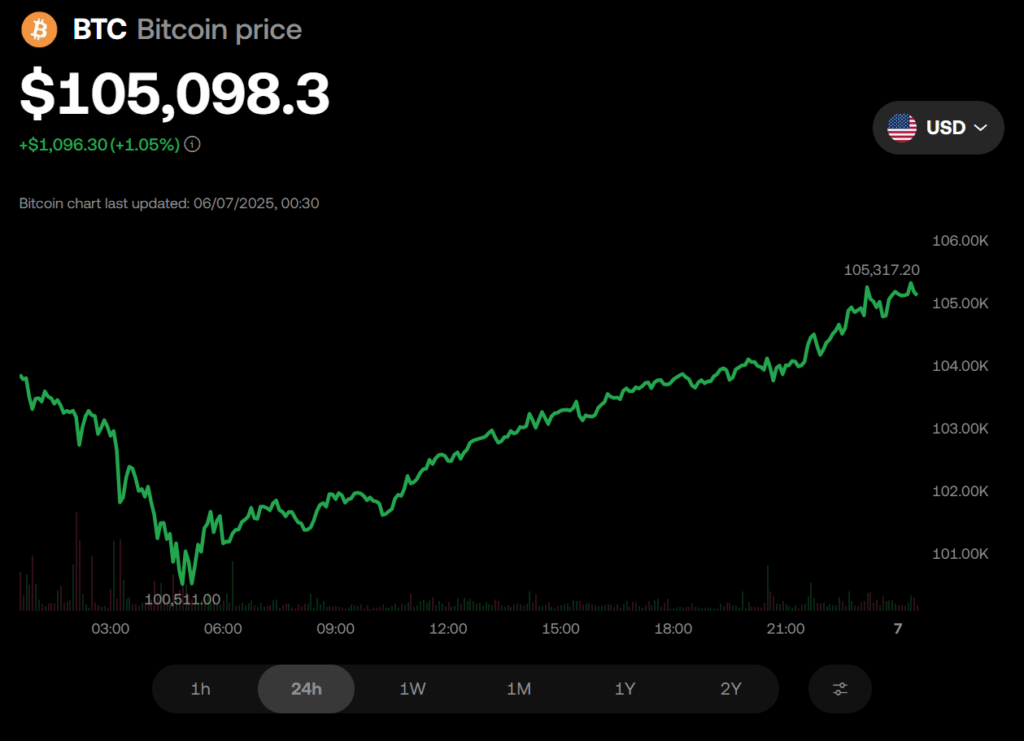
That latter level is calculated from the height of the head-and-shoulders formation. To invalidate this bearish setup, BTC needs to climb decisively above $107,000—only then can traders start thinking about new record highs again.