- Chainlink dropped to $13.70, but a sharp decline in exchange-held supply and growing self-custody suggest investor confidence is rising.
- Institutional partnerships and dominance in the oracle space—with over $43B secured—highlight Chainlink’s strong fundamentals.
- Whale selling is slowing, network activity is up, and a bullish harmonic pattern hints at a potential breakout toward $30.92.
Chainlink hasn’t been having the best time lately. It slipped to $13.70 on Monday—its lowest level since May 8—marking a 23.75% drop from its May high. The dip’s mostly in line with what we’re seeing across the board, as Bitcoin and most altcoins pulled back too. Still, there are a few key things hinting that LINK might not stay down for long.
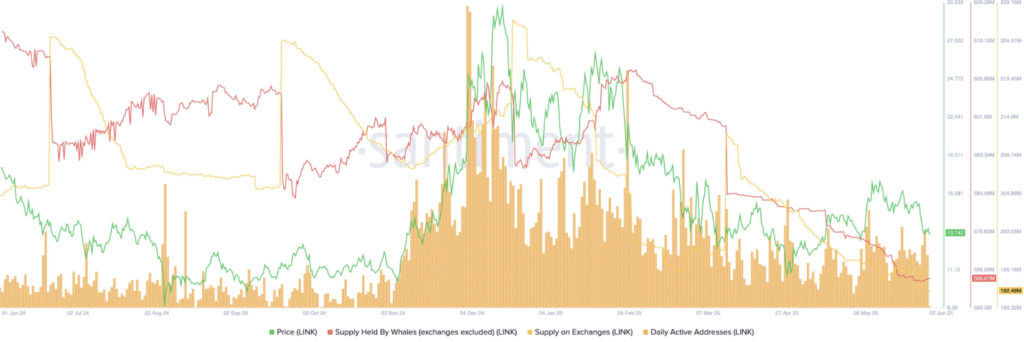
One of the biggest green flags? The supply of LINK on centralized exchanges keeps falling. Santiment data shows it dropped to 192 million tokens from 226 million back in November 2023. That usually means holders are moving coins to cold wallets—aka, they’re not looking to sell anytime soon. That kind of behavior tends to show long-term conviction.
Strong Fundamentals and Institutional Support
It’s not just about the charts—Chainlink’s actually been doing a lot behind the scenes. They’ve landed partnerships with big names like JPMorgan, ANZ Bank, UBS, and even Swift. These groups are exploring real-world asset tokenization, and Chainlink’s tech is becoming a go-to for it, especially their Cross-Chain Interoperability Protocol (CCIP), which lets different blockchains talk to each other.
Then there’s the oracle game. Chainlink’s still the king, securing more than $43 billion across DeFi protocols. The next closest? Chronicle, sitting at just $7.4 billion. That kind of lead doesn’t happen by accident—it means people trust the tech.
Whale Selling Slows Down
Another thing to watch is whale behavior. For months, large holders were offloading LINK, but that seems to be cooling off. Whale wallets now hold 566.67 million tokens—up slightly from last week’s 565.9 million. It’s not a massive jump, but it’s a shift. If this keeps up, it could mean the heavy selling is finally behind us, which would be a big plus for price stability.
At the same time, daily active addresses are climbing, suggesting network engagement is picking up. More activity on-chain usually hints at growing interest or use, both good signs for price momentum.
Technical Setup Could Fuel a Breakout
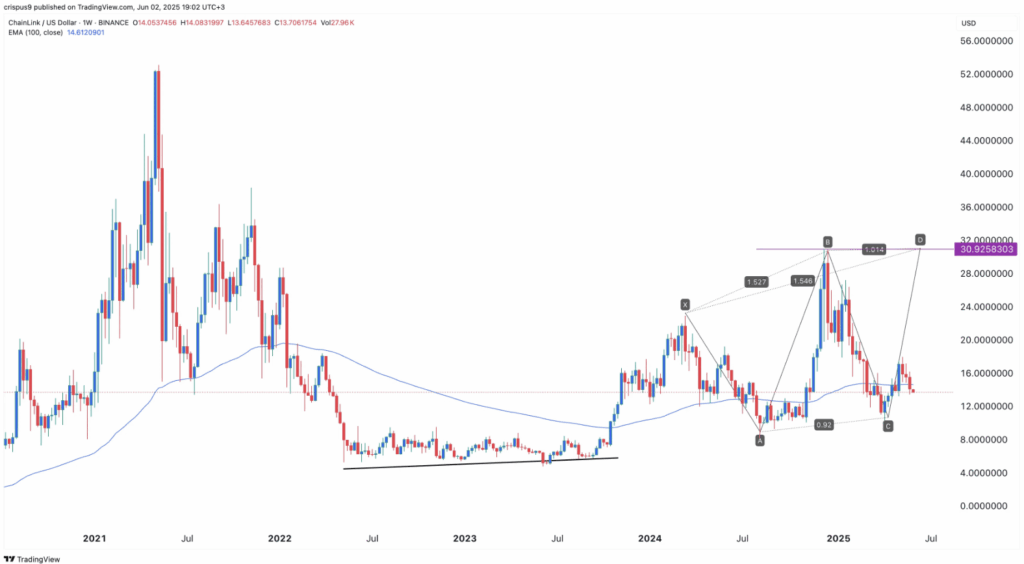
Now onto the technicals—LINK may be carving out a bullish harmonic pattern on the weekly chart. The setup? A classic XABCD formation, often followed by a strong continuation move. Here’s the rough timeline: XA ran from March to July 2023, AB pulled back into November, and BC stretched to April 2025. If that final CD leg is starting now, LINK could be headed back to its November high around $30.92. That’s a potential 125% move from where it is right now.
So yeah, while the recent drop stings, there’s quite a bit lining up behind the scenes that could turn things around for LINK. As always though—timing is everything.