- Stellar (XLM) has broken out of a bull flag pattern and is forming higher lows, signaling a potential strong upward move.
- Technical analysis points to short-term resistance but also shows hidden bullish divergence, supporting trend continuation.
- If Bitcoin climbs to $160K–$190K, XLM could surge to $2.00–$2.50 based on Fibonacci targets and its performance against BTC.
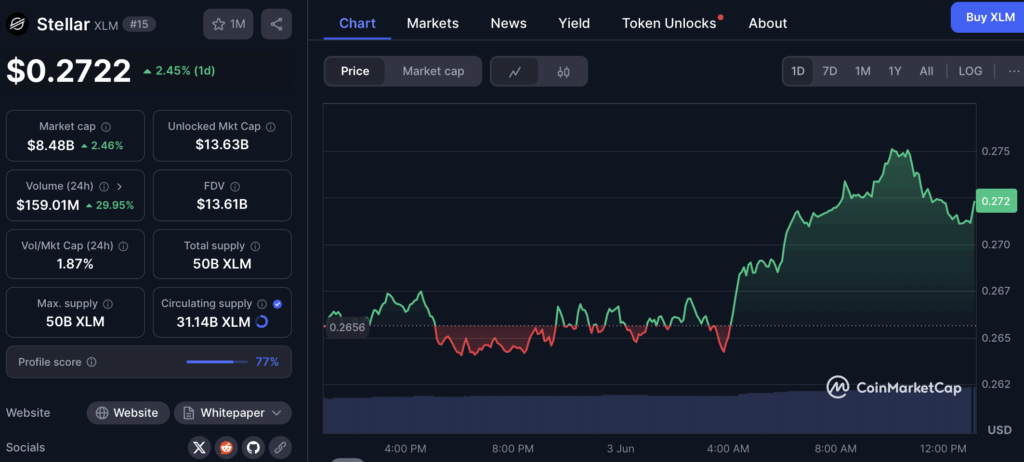
Popular crypto YouTuber C-ZAR dropped a fresh video yesterday diving into Stellar (XLM), and honestly, there’s a few interesting takeaways—especially if you’re holding or eyeing XLM. The token, often called a sleeping giant in the space, is priced at about $0.267 right now. And if the charts are anything to go by, it might be waking up soon.
According to C-ZAR, and a few chart watchers out there, XLM looks like it’s breaking out of a bull flag—a classic pattern traders associate with continuation. If that holds (and yeah, there’s always an “if”), we could be looking at some solid upside in the next few weeks.
Bull Flag Breakout Sets the Tone
Let’s start with the technical stuff. XLM has been stuck in a multi-cycle consolidation—basically just chopping sideways across market phases—but now it’s broken out of that flag. And not just a fakeout, either. It’s built a higher low, which typically signals strength and sets up for the next move upward.
There’s a tiny bit of noise on the shorter timeframes (1-hour chart shows hidden bearish divergence), but zoom out to the daily and you’ll catch something different. There’s hidden bullish divergence—RSI dipping lower while price prints higher lows. That usually means the uptrend’s still alive and kicking.
Also worth watching is the 4-hour chart. There’s resistance right around the 0.5 Fibonacci retracement zone—always a tough spot—but so far, price action’s holding its ground. A clean move past that? That could open up more runway for bulls.
Price Targets: $2 Isn’t Just Wishful Thinking
Okay, let’s talk numbers. Based on the size of the bull flag breakout, $1.40 seems like a reasonable first target. But when you layer in some broader market stuff—like Bitcoin potentially running to $160K or more—XLM starts to look even better. If Stellar keeps outperforming BTC, a $2 to $2.46 price tag actually makes sense.
Zooming out to the monthly XLM/BTC chart, there’s a similar bull flag there too. And if that plays out the same way, it could seriously boost XLM’s USD value. Not saying it’s guaranteed—but the technicals do line up, and the math’s not crazy either.
All Eyes on the Next 6 Weeks
In short, if Bitcoin climbs and market momentum stays on track, Stellar might finally make that bigger move. The $2–$2.50 range isn’t just hopium—it’s backed by patterns, ratios, and past setups. Of course, a lot depends on BTC’s pace and whether macro conditions hold steady.
So yeah, not financial advice or anything—but for anyone chasing high-reward setups, XLM’s charts are looking kinda spicy right now. Just keep an eye on that next leg up.