- Decreased Exchange Reserves: LINK tokens are steadily flowing out of exchanges, suggesting reduced sell pressure and long-term holding behavior among investors. This aligns with bullish sentiment, though a breakout isn’t guaranteed just yet.
- Whales Stay Quiet, But Signals Are Building: Large transactions have dipped, showing whales aren’t buying heavily—yet. Still, the accumulation trend combined with low selling hints at cautious optimism.
- Technical Chart Shows Range-Bound Price With Bullish Potential: LINK is trading between $10.8 and $15.5. While it recently faced rejection near the range top, a rising OBV (On-Balance Volume) hints at growing buying strength, possibly setting up for a breakout soon.
Chainlink’s been oddly calm lately, but some subtle signs are starting to bubble up beneath the surface—signs that might hint at something bigger on the horizon. Let’s unpack it.
Exchange Reserves Are Dropping, Which Is… Interesting
So, one thing standing out? Exchange reserves for LINK have dipped a bit. Not a massive drop, but enough to suggest folks aren’t exactly rushing to dump their bags. On the 1-day chart, the SuperTrend indicator was flashing green—not like a full-blown breakout, but it’s leaning bullish.
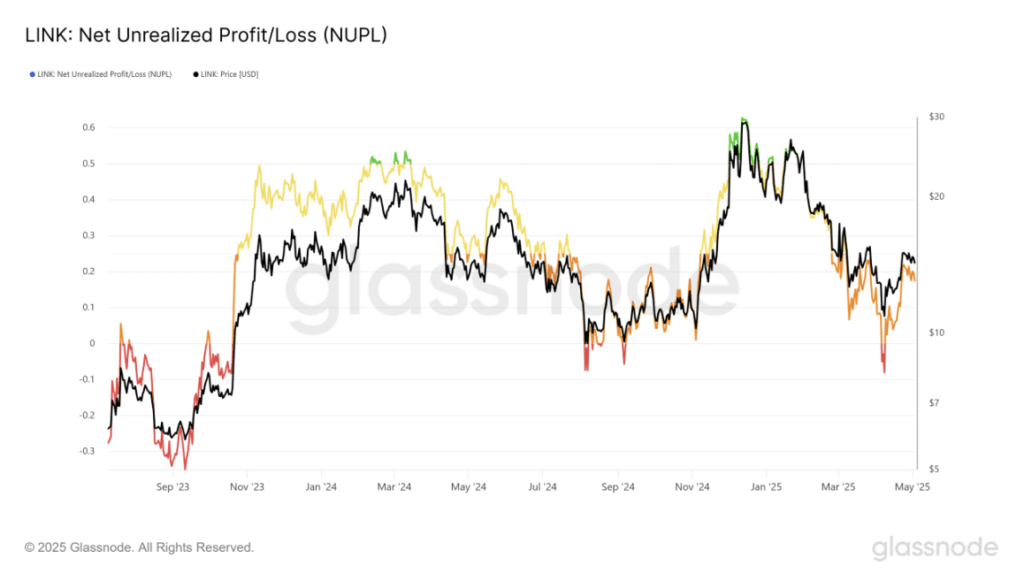
Over on the NUPL (Net Unrealized Profit/Loss) metric from Glassnode, things hit what they call “capitulation levels” back in early April, when LINK was chilling around $11. Kinda grim—but that’s also what happened last August/September before prices made a run for $29. Deja vu? Maybe.
Whale Moves Are Muted, But That’s Not Always Bad
Looking at the Net Transfer Volume to/from Exchanges (7-day MA), the numbers have been red since late March. That means more LINK has been leaving exchanges than entering. Usually, when people pull coins off exchanges, they’re thinking long-term—not looking to panic sell.
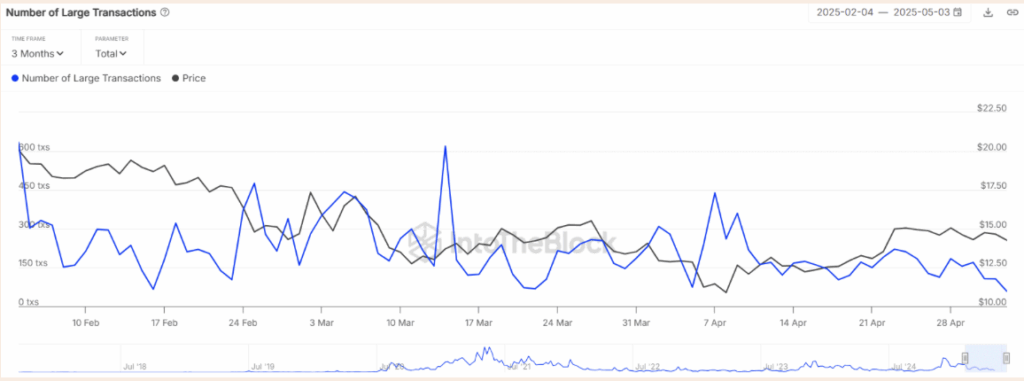
Meanwhile, data from IntoTheBlock showed fewer large transactions lately. So whales aren’t panic-selling, but they’re also not scooping up tons either. Feels like they’re waiting to see which way the wind blows before making a move.
The Chart Shows a Tug-of-War—But with a Bullish Underpinning
Now, about the price itself—LINK’s been stuck in a pretty clear range between $10.8 and $15.5. It got smacked down from the top of that range just recently and is now floating closer to the $13-ish support zone.
But here’s the part that’s kind of sneaky bullish: the OBV (On-Balance Volume) has been quietly climbing since March. It’s one of those under-the-radar signals showing steady buying pressure, even during all this sideways chop. If that trend holds, it could be setting the stage for LINK to pop past the range highs sometime soon.