
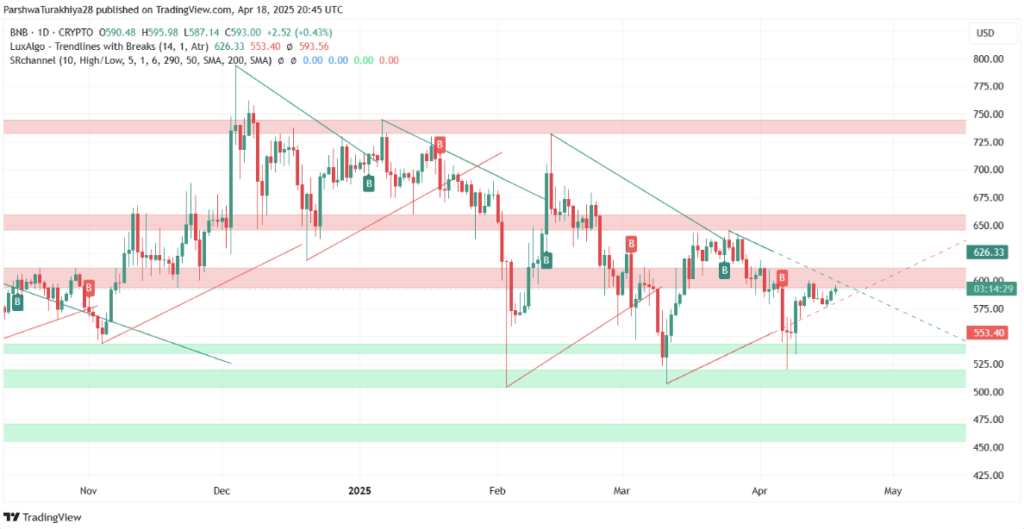
- BNB is trading around $592, reclaiming key EMAs and breaking out of a short-term downtrend.
- A daily close above $600 could trigger a move toward $626 or even $660, with the golden pocket at $606 acting as the next major test.
- Momentum’s building—MACD is bullish, RSI’s holding steady, but volume confirmation is still needed. Keep your eyes on that $600 level—it’s the game-changer.
Binance Coin (BNB) is starting to stir again—after a rough patch earlier this month, it’s now creeping up the charts and teasing a technical breakout. As of Thursday, BNB’s sitting around $592, reclaiming a bunch of moving averages and poking above a stubborn descending trendline. Yep, things are starting to look a little more bullish.
On both the 4-hour and daily charts, the token’s broken out of its short-term bearish funk and flipped key EMAs—the 20, 50, and 100 are now sitting comfortably below price between $586 and $589. That’s great and all, but the big one—the 200 EMA at $594.48—is still looming. That’s the last domino before a full trend shift kicks in.
Retest, Reclaim, Repeat
Zooming in, the $585–$589 region has now become a key support zone, thanks to several successful retests. So far, BNB is holding up well. If bulls can lock in a daily candle above the $594–$600 range, the next targets on deck are $626 and $660. These line up with key horizontal levels from back in March, plus that ever-important golden pocket on the Fibonacci retracement—always a spicy area for traders.
MACD, RSI, and Other Good Stuff
The indicators are flashing green—well, mostly. On the 4H chart, MACD just crossed above the signal line and those green histogram bars are getting chunkier, which usually hints at continued bullish momentum. RSI is sitting around 59.15, so there’s some upside left before things get overheated.
Bollinger Bands are widening too, showing that volatility’s picking up. Price is currently surfing the upper band—bullish sign. That said, a little yellow flag: the CE indicator flashed a sell signal near $594, so traders might want to hold off on the confetti until we get a clean close above that level.
Weekly Outlook: The Golden Pocket Challenge
Let’s talk Fibonacci. The 0.618 retracement level around $606 is where things could really get interesting. That’s drawn from the 2023 high ($794) down to the 2024 low ($400). This “golden pocket” zone has a rep for being serious resistance—so if BNB can muscle its way through and close above $606 on the weekly chart? That’s your trend reversal right there.
Of course, if bulls fumble and price drops below $577, the setup weakens. Below that, support sits at $553, then $530. Not a disaster, but definitely a dent in the rally narrative.
Final Take
BNB’s slowly piecing together a solid recovery after that brutal March–April slide. Breaking above $577 last week was step one. Now it’s all about that $600 breakout level. Volume’s been steady, momentum looks decent, and structure is improving—but confirmation is key. A strong move above $600 could open the floodgates for more upside… but for now, the market’s holding its breath.