Crypto prices pumped on Friday despite Fed Chair Jerome Powell’s hawkish stance last week. Bitcoin (BTC) jumped 6.65% to brush shoulders with $21,500, Ethereum (ETH) recorded a high of $1,677 on Coinbase, and Binance Coin (BNB) jumped above $350. 11th placed Polygon (MATIC) rallied 22.5% to $1.80. The total crypto market cap jumped to $1.06 trillion following that rally.
The prices, however, turned slightly down over the weekend, with the flagship cryptocurrency closing the trading day on Sunday in red. At the time of writing, Bitcoin is trading in a second straight bearish session at $20,863. Are the bulls strong enough to diminish further drops?
Bitcoin Price Needs To Hold Above $20,600
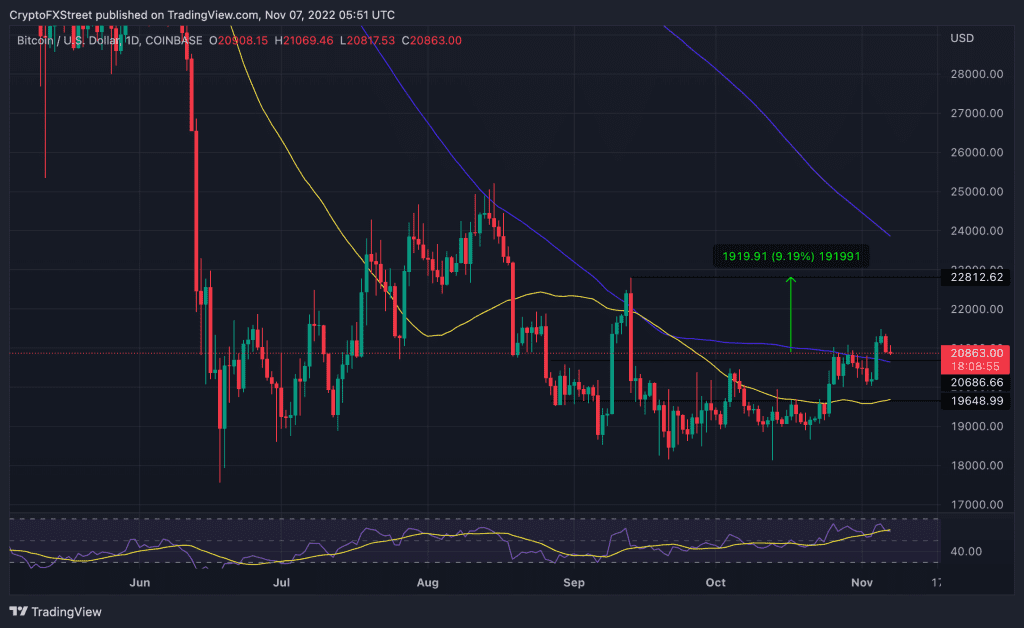
The recent rally saw the significant crypto rise above the 100-day SMA, which sat at $20,680 and shattered the $21,000 resistance level before correcting toward the $20,800 zone.
The flattening moving averages and the appearance of a Doji candlestick at the end of the chart indicate a decisive battle between buyers and sellers. The bulls are fighting to hold the big crypto above the 100-day simple moving average (SMA), currently at $20,600. If they succeed, the logical direction of movement for the BTC price would be upward.
With the RSI at 60, the bulls will attempt to push the price to the $21,000 supply level and later to the $22,000 psychological level before climbing to confront the resistance from the $22,800 range high. This would represent a 9.19% ascent from the current price. If this happens, a recovery to $25K would be probable.

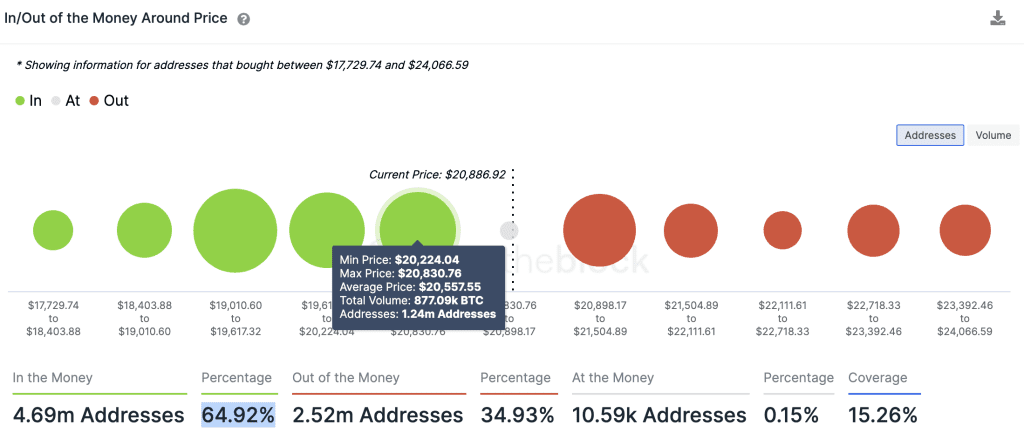
Also supporting Bitcoin’s optimistic outlook was on-chain data from IntoTheBlock, a blockchain analytics firm. It’s In/Out of the Money Around Price (IOMAP) model corroborated the importance of the support level provided by the 100-day SMA around $20,600. According to the metric, this level is within the $20,224 and $20,830 price range, where around 1.24 million addresses previously bought approximately 877,090 BTC.
Any attempts to push the price below this point could be met with buying pressure from this cohort of investors seeking to increase their profits.

The same IOMAP chart showed that around 65% of Bitcoin Hodlers “are in profit at the current price. This is a bullish sign for the bellwether digital currency as these investors may want to hold on longer to their BTC to maximize their profits.
Generally, the IOMAP shows that Bitcoin’s price is facing relatively weaker resistance on the upside, making it the easier path of movement.
The Flipside
On the downside, if the bears win the ongoing battle to control the price, BTC could turn down from the current levels. With BTC trading in the red and the RSI facing downward, the price of the pioneer cryptocurrency may drop toward the $20,000 psychological level. Investors could expect the price to accumulate here for a few days before showing any directional bias.
Further down, Bitcoin’s price may drop to tag the 50-day SMA currently sitting at $19,660 or lower toward the $1,800 supply level.
However, with the ongoing battle between the bulls and bears, it would be best to wait and see who emerges victorious before placing your trades.


