
- Bitcoin’s long-term structure shows cyclical rallies followed by deep but temporary pullbacks.
- Price recently tested resistance near all-time highs before facing rejection.
- Long-term support levels will dictate whether BTC can sustain its bullish momentum.
Testing All-Time Highs: Resistance Near Key Psychological Levels
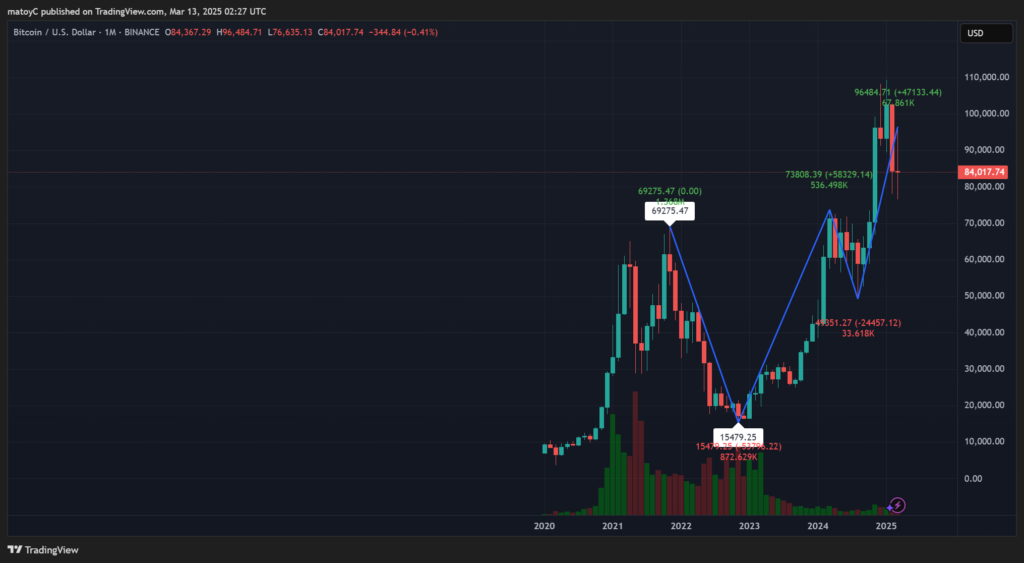
Bitcoin’s latest monthly chart tells a story that seasoned traders will recognize—massive rallies followed by equally strong corrections. The previous bear market cycle saw BTC bottom out near $15,500, a key accumulation zone that mirrored earlier cycle lows. From there, Bitcoin began a steady climb, pushing through multiple resistance levels until it reached more than $100,000, its prior all-time high.
Historically, Bitcoin has struggled to break through psychological barriers in a single attempt, leading to corrective phases. The current rejection suggests that profit-taking and distribution are occurring near this level, which could mean another period of consolidation before the next major push.
Support Levels to Watch: Where Could Bitcoin Pull Back?
A crucial factor in Bitcoin’s next move lies in how it interacts with long-term support zones. A retracement to the $73,000-$75,000 area would align with past cycles, where BTC typically retests previous breakout levels before continuing higher. A deeper pullback to $65,000-$68,000 is also possible if market sentiment shifts or external factors trigger sell-offs.
Bitcoin’s monthly structure suggests that higher lows continue to form, reinforcing the idea that macro bullish momentum remains intact. If BTC remains above the key $70,000 region, it could set the stage for another strong rally toward six-figure price targets. On the other hand, a break below major support could lead to an extended consolidation phase before another attempt at new highs.
Bitcoin’s Next Potential Expansion Phase
Looking at historical trends, Bitcoin’s long-term growth follows a cyclical pattern. Each bull cycle has been characterized by a parabolic rally, followed by a 50-80% drawdown, only for the asset to recover and surpass previous highs. If this pattern holds, the next leg up could see BTC reaching $120,000-$140,000 in the next expansion phase.
However, if Bitcoin fails to reclaim $90,000 in the short term, the likelihood of further consolidation increases. A scenario where BTC ranges between $70,000 and $90,000 for several months before a confirmed breakout aligns with past behavior. Traders and investors will closely monitor how BTC reacts to current resistance levels to gauge the strength of the ongoing cycle.
Bitcoin’s trajectory remains strongly influenced by macro factors, including institutional adoption, regulatory shifts, and liquidity cycles. While short-term volatility is expected, the broader trend suggests Bitcoin is still following its historical price structure, with higher highs and higher lows forming over time.