
- BONK Breaks Downtrend, Eyes Resistance – BONK surged above $0.012594, bouncing off $0.011603 support, with a bullish EMA crossover signaling potential upside toward $0.014706.
- Volatility & Liquidity Risks Loom – Market swings remain high, with liquidity clusters at $0.0125–$0.0140, making breakouts or sharp reversals likely depending on trader activity.
- Memecoin Hype Fuels Speculation – Growing community engagement and exchange activity could push BONK to $0.0160, but a dip below $0.0110 could trigger further losses.
BONK has been making waves lately, attempting to break free from a prolonged downtrend. A sudden price surge, shifting technical indicators, and evolving liquidity patterns suggest a possible trend reversal—but the market remains unpredictable.
Price Action & Key Support Levels
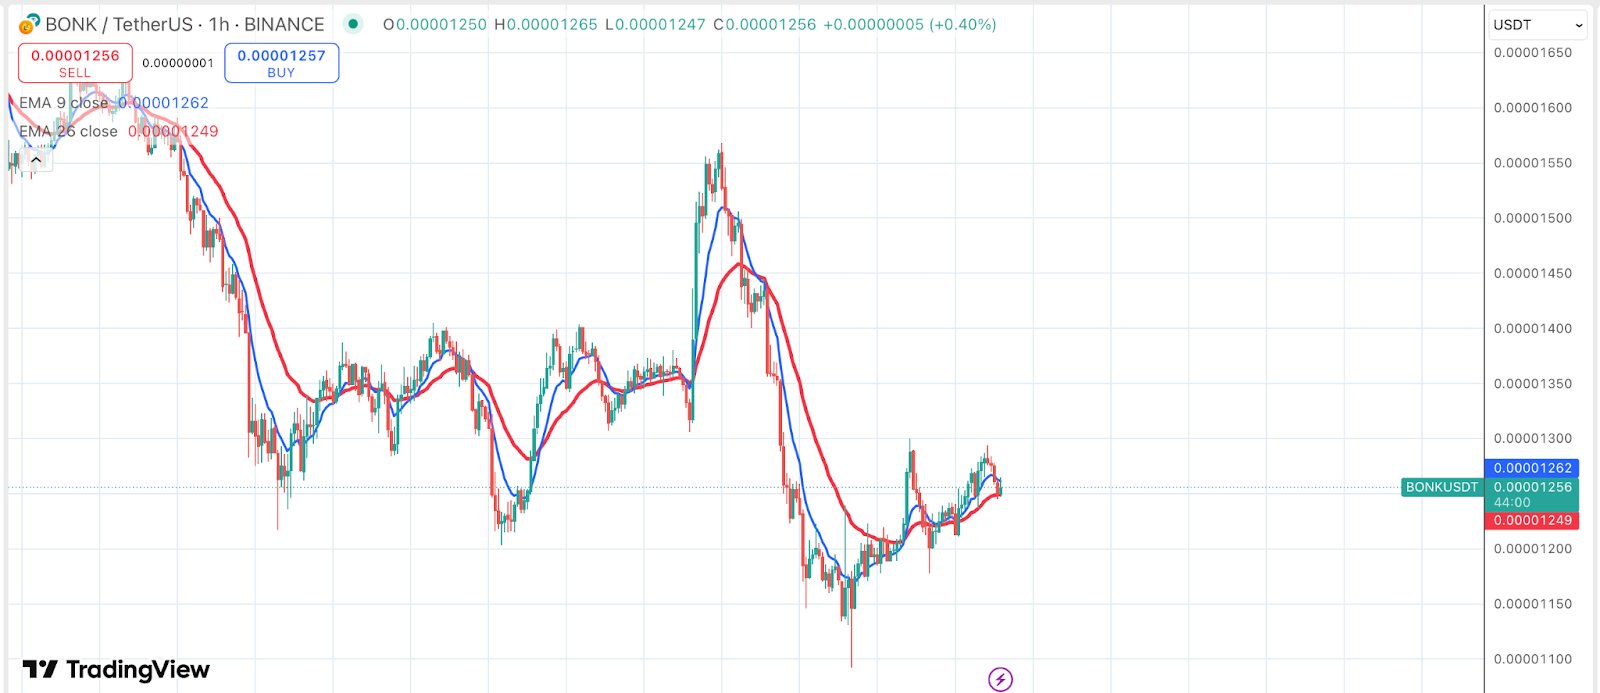
Looking at the 1-hour chart, BONK broke above a descending trendline, climbing to $0.012594 after bouncing off Fibonacci retracement support at $0.011603.
This level has acted as a solid foundation, potentially setting the stage for a rally toward $0.014706 resistance. Meanwhile, a bullish crossover between the 9-day and 26-day EMA at $0.012145 and $0.012102 reinforces the possibility of a breakout—though recent market volatility keeps traders on edge.
Momentum Signals & Risks
- RSI at 65.98 – Above the neutral 50, signaling strong momentum but flirting with overextension.
- If BONK stays above $0.012102, it could push for a test at $0.014706—potentially triggering a broader uptrend.
- If it slips below $0.011603, the breakout could be invalidated, sending prices back into a downtrend.
Volatility: A Stabilizing Force or a Market Shaker?
The 1-hour BONK/USD chart revealed a Volatility Index of 0.012132, with the price sitting at $0.012687, down 1.44%—hinting at heightened instability.
Key Observations:
- Price fluctuates between $0.011000 and $0.015000, a range where past corrections have played out.
- Peaks above $0.014000 indicate extreme volatility, often followed by sell-offs.
- Dips below $0.012000 typically signal market stabilization, encouraging a potential rebound.
High volatility could disrupt BONK’s bullish push, causing sharp sell-offs if volatility spikes beyond $0.015000. On the flip side, if BONK stabilizes below $0.012000, it may provide a stronger foundation for growth, fostering trader confidence.
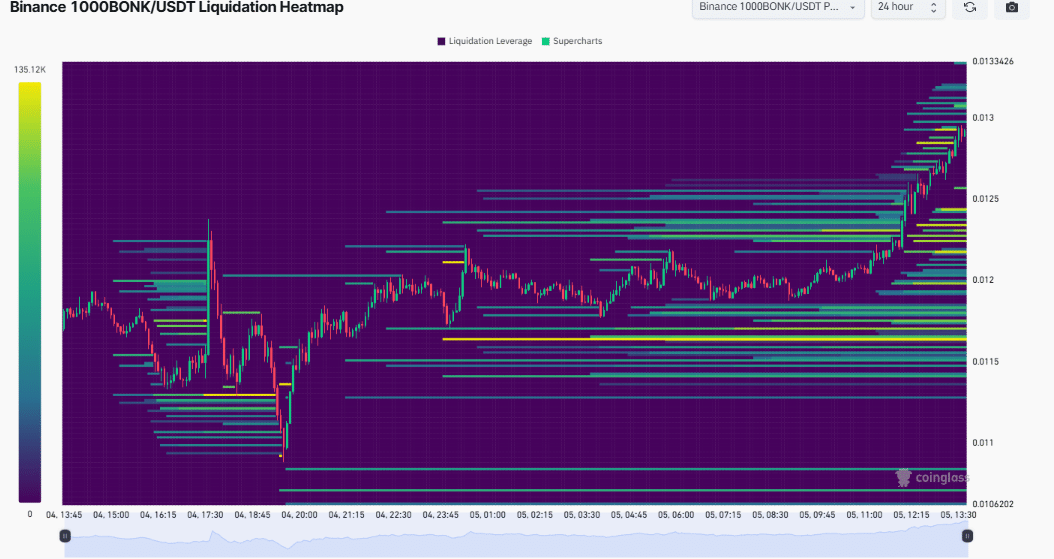
Identifying Key Price Levels: Where’s the Liquidity?
BONK’s 24-hour liquidation heatmap on Binance highlights critical liquidity clusters that could dictate price movements.
Press-Time Data:
- Price: $0.013242
- High-liquidity zones: $0.0125, $0.0130, and $0.0140
- Liquidation risk spans $0.0110 to $0.0150, amplified by leverage up to 125x.
A breakout above $0.0140 could trigger a wave of liquidations, pushing BONK toward $0.0150. On the other hand, a drop below $0.0120 could lead to cascading losses, potentially sending BONK back toward $0.0110.
This pattern mirrors past trends, where liquidity gaps triggered sharp price moves, making BONK highly reactive to market shifts.
Can BONK Maintain Its Momentum?
BONK’s breakout from a descending trendline, EMA crossover at $0.012145 and $0.012102, and RSI at 65.98 all hint at bullish momentum. However, liquidity clusters and volatility risks could quickly change the landscape.
With memecoin hype on the rise, BONK is seeing increased community engagement and exchange activity—a key driver of speculative price action.
Possible Scenarios:
- If BONK holds $0.011603 support and surpasses $0.014706, a run toward $0.0160 is possible.
- A break below $0.0110, however, could usher in a bearish phase, testing $0.0100.
BONK’s trajectory closely mirrors past memecoin cycles, where retail-driven enthusiasm fueled extended rallies. The token’s fate now hinges on volatility control, liquidity movements, and broader market sentiment—offering both high-risk and high-reward opportunities in the altcoin space.