Most cryptocurrencies were trading with a bullish bias during the early Asian trading hours on October 12, as the total crypto market cap increased 0.56% from the previous day to $926 billion. Over the last 24 hours, the whole crypto market volume fell 10.40% to $47.72 billion.
The DeFi crypto market cap was $45.25 billion, a 19.40% decrease over the last day. The overall market capitalization for stablecoins was $149.96 billion, with a total volume of $45.89 billion, accounting for 94.68% of the entire 24-hour volume of the crypto market.
At press time, Bitcoin (BTC) was trading with a slight bullish bias at $19,142, up 0.33% on the day. The now proof-of-stake Ethereum (ETH) had risen 1.35% over the past 24 hours to exchange hands at $1,300, according to data from CoinMarketCap.
Extreme Fear And Greed Index Suggest “Risk Sentiments” Amongst Investors
In a highly volatile space such as the cryptocurrency industry, the market sentiment often changes with different displays of emotion. This has given rise to the phrase, “The market is usually psychological.” This points to behavioral finance, which is at the heart of what trading is all about and drives crypto prices.
The principles of behavioral finance hold that when the market rises, greediness can cause investors to act in ways that they might later regret due to what is referred to as fear of mission out (FOMO). Contrastingly, a sudden sell-off can cause people to offload their cryptos for no good reason.
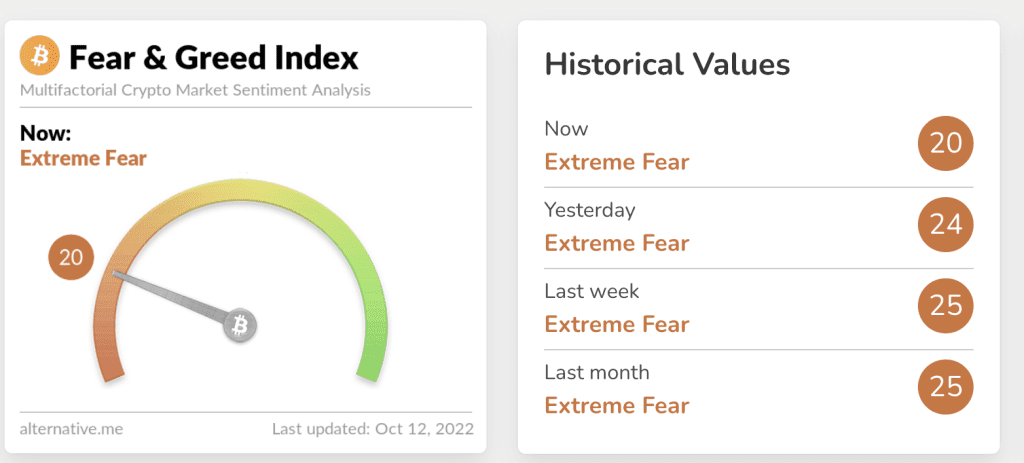
According to data from Alternative, a firm that analyzes emotions and sentiments of the crypto market, the crypto fear and greed index is down 4 points in the last 24 hours to 20, but still in the ‘Extreme Fear’ zone. An area it has been stuck in for most of the previous two months, a sign that investors are too worried and may sell their holdings to minimize losses.

This implies that the cryptocurrency market remains in a “risk-off” mode as investors avoid risky assets and continue to invest in safe-haven assets such as the US dollar, gold, and government bonds.
However, Alternative notes that “Extreme Fear” scenarios are an indication that indicate that investors are overly concerned. This offers an excellent opportunity for late investors to invest in cryptos. According to Arcane Research, they buy when the Crypto and Fear Index reaches a score of 8 or below, resulting in an average median one-month return of 28.72%.
Bitcoin Price Technical Analysis
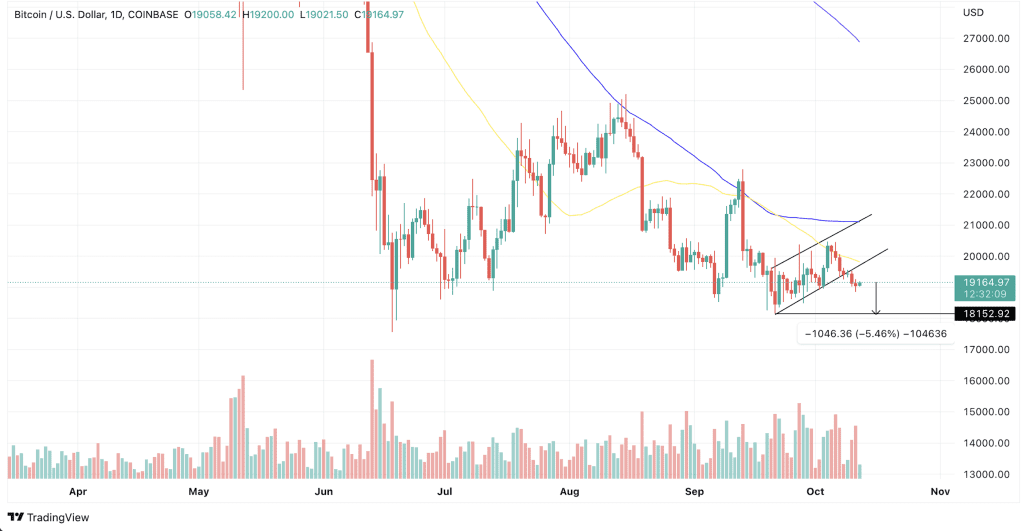
As shown in the daily chart, BTC was trading below an ascending parallel channel. This technical chart pattern projects a 5.46% drop from the current price if the big crypto fails to hold above the $19,000 support level. Such a move would trigger a descent to $18,500 and later toward the $18,000 psychological level. On the upside, a bullish breakout would be triggered by a rise above the 50-day simple moving average (SMA) at $19,800, triggering a rally toward the bullish target of the prevailing chart pattern around $21,350.

Even though the current macro condition continues to paint doom for the favorite crypto, the daily chart revealed that the BTC price has not stayed below $18,000 since October 2020. As such, a drop to these levels could provide a launching pad and bolster Bitcoin’s price back into the ascending channel, placing it on track for recovery.


