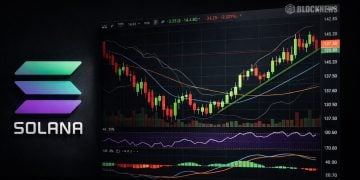
- Solana struggles to maintain momentum above $250, facing significant selling pressure and resistance.
- Reduced trading volume on recent highs signals declining buyer confidence and momentum exhaustion.
- A breach below $235 could trigger a deeper correction toward lower pivot levels.
Solana’s price movement based on TradingView indicates a clear rejection at the R3 resistance level around $240–$259.51, as shown on the updated chart. This area represents a strong selling zone where traders are taking profits following the recent rally. The decline to $241.93 marks a 4.39% drop on the day, underscoring bearish sentiment.
The inability to sustain gains near the resistance suggests that Solana’s recent bullish momentum may be waning. Coupled with declining trading volume, this hints at reduced investor interest, a warning sign for further potential losses.
Critical Support Levels Under Threat
If the bearish trend persists, Solana’s price could test the immediate support near $235 (R3 pivot level). A failure to hold this level might pave the way for a decline toward the next support range of $211.81 (R2) or even $186.23 (R1).
The Relative Strength Index (RSI) also shows signs of overextension, indicating that Solana may be entering overbought territory. Historically, this condition has preceded price corrections.

Bearish Outlook for December
The volume analysis shows a clear divergence between price movement and trading activity. While the price reached higher levels earlier this month, volume has not matched the same enthusiasm, a potential precursor to market fatigue.
A drop below $235 could exacerbate selling pressure, potentially dragging Solana toward $190 or lower if broader market conditions remain unfavorable. Unless buyers step in at these key levels, the asset risks a prolonged consolidation or further losses in December.


