- Solana’s token price drops 3% as network activity and total value locked decline
- Memecoins on Solana see daily losses, affecting overall market sentiment and trading volume
- Bearish RSI divergence signals potential correction, prompting traders to take profits
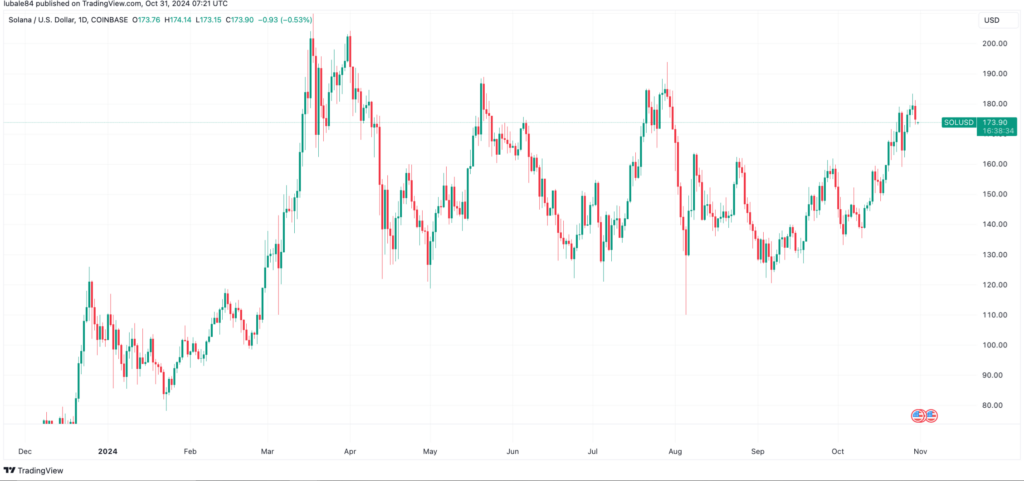
Solana’s native cryptocurrency, SOL, saw a 4% decline on October 31, reflecting broader market corrections and reduced on-chain activity. Trading data from TradingView placed SOL at $173, continuing a downtrend after failing to sustain levels above $180 on October 30.

Source: TradingView
Network Activity and Total Value Locked Drop
A significant factor behind SOL’s dip is reduced user engagement on the network. Data from DefiLlama indicates that the total value locked (TVL) in Solana’s ecosystem decreased from $7.2 billion on October 27 to $6.2 billion by October 31, marking a 13.9% decline. This downturn points to lower interaction from users and developers within the network.
Further analysis from Blockworks Research noted a sharp drop in Solana’s economic activity, with revenues from base and priority fees slipping from a peak of $11.1 million on October 24 to $7 million at present. Such economic shifts contribute to diminished investor confidence.
Memecoins and Market Impact
Memecoins linked to Solana have also faced setbacks, contributing to SOL’s price slide. Leading tokens like Dogwifhat (WIF) fell 1.5% over 24 hours, while Bonk (BONK), Cat in a Dogs World (MEW), and Book of Meme (BOME) posted daily declines of 5.4%, 5.0%, and 3.7%, respectively, based on CoinGecko data. The sharpest losses were recorded for Gigachad (GIGA) and Goatsues Maximus (GOAT), dropping 8.7% and 7%.
According to CoinMarketCap, the overall market capitalization of Solana-based tokens shrank from $277.9 billion to $275.3 billion on October 31, with trading volumes dipping 25.8%. The decline in these metrics has influenced negative investor sentiment, resulting in SOL’s ongoing price correction.
Technical Analysis Suggests Bearish Trends
The downward trend in SOL’s price aligns with a technical pattern known as bearish divergence. Between October 24 and 29, SOL’s price hit higher highs, while its relative strength index (RSI) trended lower, signaling weakening momentum. When combined with overbought conditions on October 24, when the RSI reached 72, this indicated potential buyer fatigue and triggered profit-taking among traders.


